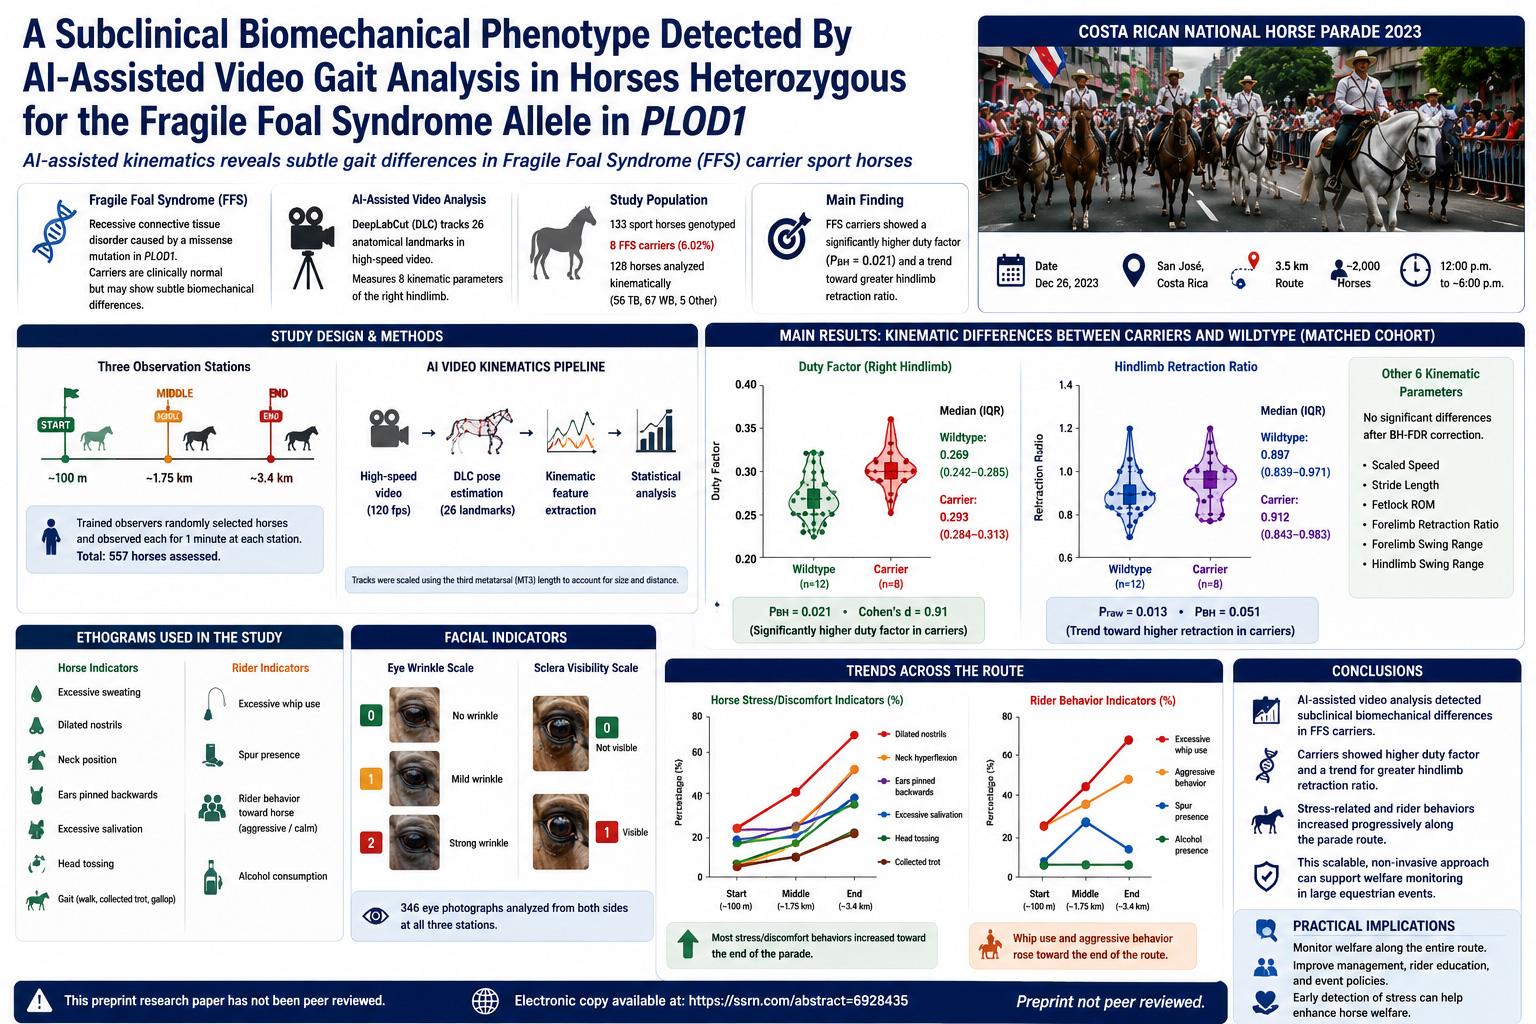
A non-peer-reviewed preprint study investigates whether sport horses carrying one copy of the Fragile Foal Syndrome allele in the PLOD1 gene show subtle biomechanical differences detectable through AI-assisted video gait analysis. Fragile Foal Syndrome is a lethal recessive connective-tissue disorder when a foal inherits two copies of the variant, but heterozygous carrier horses usually appear healthy and may compete normally. This study asks a more precise question: even if carriers look clinically normal, does their locomotion carry a measurable subclinical signature?
The researchers analyzed sport horses using markerless video kinematics based on DeepLabCut, a deep-learning pose-estimation tool. In the full cohort, 133 horses were genotyped, and 128 remained for kinematic analysis after quality-control exclusions. Eight horses were identified as FFS carriers. In a matched subset of 20 FEI-level eventing horses, including 8 carriers and 12 wildtype controls, carriers showed a significantly higher right hindlimb duty factor than wildtype horses. Duty factor increased from a median of 0.269 in wildtype horses to 0.293 in carriers, with P_BH = 0.021 and Cohen’s d = 0.91. Carriers also showed a trend toward higher hindlimb retraction ratio, but this narrowly missed the Benjamini-Hochberg corrected significance threshold. The study suggests that FFS carrier status may be associated with subtle gait changes consistent with increased connective tissue compliance, but the evidence is exploratory and requires larger replication.
This study sits at the intersection of genetics, equine biomechanics, sport-horse performance, animal welfare, and artificial intelligence. Its central question is scientifically interesting because Fragile Foal Syndrome, or FFS, is usually discussed as a breeding-risk disorder: when two carrier horses are bred together, a foal may inherit two copies of the causal allele and suffer a severe, usually fatal connective-tissue condition. This paper asks a different question. What if a horse carrying only one copy of the allele is not simply “normal” in every biomechanical sense? What if carrier status produces a subtle movement phenotype that is invisible to ordinary clinical observation but detectable through quantitative gait analysis?
The study focuses on the PLOD1 gene, which encodes lysyl hydroxylase 1, an enzyme involved in collagen crosslinking. Collagen crosslinks help determine the mechanical behavior of connective tissues such as skin, tendons, and ligaments. In affected foals with two copies of the FFS allele, connective tissue failure can be severe, including hyperflexible joints, thin and stretchy skin, and in extreme cases rupture of the abdominal wall. Heterozygous carriers, however, generally live normal lives and may compete at high athletic levels. This creates a biological puzzle: if one copy of the variant does not cause overt disease, could it still alter connective tissue mechanics enough to influence gait?
The question matters because locomotion is a central trait in sport horses. Movement quality affects dressage scores, jumping performance, eventing suitability, breeding value, market price, veterinary soundness, and welfare. Traditionally, gait is evaluated by expert visual assessment. Experienced veterinarians, judges, trainers, and breeders can see many important features, but visual assessment has limitations. It can be subjective, variable between observers, and insufficiently precise for detecting very small biomechanical shifts. A subclinical phenotype, by definition, may not be obvious enough to see reliably with the naked eye.
The authors therefore use AI-assisted digital video kinematics. This approach is important because many gold-standard biomechanical methods are hard to scale. Force plates and three-dimensional optical motion capture can provide high-quality measurements, but they require specialized facilities, controlled setup, and time-consuming preparation. Wearable inertial measurement units can be useful, but they may be optimized for lameness detection rather than research-grade subtle locomotor phenotyping, and attached sensors may slightly alter movement or posture. Markerless video analysis offers a scalable alternative: record horses moving naturally, use AI to label body landmarks frame by frame, and extract quantitative gait parameters.
The paper used DeepLabCut, a widely used deep-learning framework for markerless pose estimation. In this study, videos were processed to label 26 anatomical landmarks referencing joint centers and high-motion areas. DeepLabCut produced X and Y coordinates for each landmark in every video frame. Those coordinates were then converted into locomotor parameters. This is not AI making a biological diagnosis. It is AI helping turn ordinary video into numerical movement data that can be statistically analyzed.
The study design had two main parts. First, the authors examined kinematic variation across a broader population of sport horses filmed at home facilities. Second, because only eight FFS carriers were found, they created a smaller matched case-control subset to compare carrier and wildtype horses more fairly. This distinction is crucial. The full cohort helps describe population-level variation, breed-group effects, and carrier frequency. The matched subset is where the genotype-biomechanics question is tested more directly.
The full animal cohort included 133 privately owned mature horses aged 3 to 26 years, with a mean age of 9.6 ± 5.5 years. The sample included 94 geldings, 35 mares, and 4 stallions from 22 sport-type light horse breeds and registries. The researchers simplified these into three breed groups: 57 Thoroughbreds, 70 Warmbloods, and 6 horses classified as Other, including Saddlebred, Quarter Horse, Mustang, American Paint Horse, and Anglo-Arabian. These horses represented varied fitness levels typical of sport horses competing in dressage, show jumping, and three-day eventing.
Each horse was filmed trotting naturally in hand, wearing a halter and lead, at its own farm. The track was defined by cones and designed to mimic the straight, firm-surface path commonly used for clinical lameness evaluations. Track length varied between 12 and 20 meters depending on available footing, which included firm sand, gravel, or grass. The camera was placed perpendicular to the horse’s path of travel, aiming for a 90-degree angle between camera and movement path. A Sony α6400 camera recorded at 1080 × 720p resolution and 120 frames per second. This high frame rate is useful because trot biomechanics depend on timing across stride phases.
Figure 1 on pages 29 and 36 shows the distribution of eight kinematic variables by breed group in the full kinematic cohort of 128 horses. The figure uses violin plots, individual data points, and box plots for Thoroughbred, Warmblood, and Other groups. It is useful because it shows both central tendency and spread. The figure supports the main breed-group result: scaled speed differed significantly after correction, with Warmbloods trotting faster than Thoroughbreds.
Before analysis, the authors performed quality control. Five horses were excluded because at least one kinematic parameter exceeded a z-score threshold of |z| > 4.0 standard deviations. This threshold was meant to remove physically implausible values likely caused by DeepLabCut labeling artifacts, handler limb misclassification, keypoint errors, or camera motion rather than true biological movement. After this filtering, 128 horses remained for kinematic analysis.
The eight measured kinematic variables were scaled speed, stride length, duty factor, right hind fetlock range of motion, forelimb retraction ratio, hindlimb retraction ratio, forelimb swing range, and hindlimb swing range. Several of these require explanation. Scaled speed measured movement in third-metatarsus lengths per frame, allowing comparison between horses of different size. Scaled stride length measured third-metatarsus lengths per stride. Duty factor measured the proportion of the stride cycle spent in stance for the right hindlimb. A higher duty factor means the hoof spends proportionally more time on the ground during the stride.
Retraction ratio is a newer measure introduced by the authors. It compares maximum limb retraction with maximum limb extension and is meant to provide a speed- and size-independent index of hoof flight path. In simpler terms, it asks how the limb shortens and recoils during swing relative to its extension. This is relevant to connective tissue because tendons, ligaments, joint capsules, and other elastic structures influence how limbs store and release mechanical energy.
Genotyping was performed on 133 horses using hair-root DNA. The authors targeted the Fragile Foal Syndrome polymorphism in PLOD1, specifically NC_009145.3(PLOD1):g.39927817G>A, also described as PLOD1 c.2032G>A. They used PCR-RFLP and independently confirmed genotypes with Sanger sequencing. The wildtype G allele is cut into 102 bp and 64 bp fragments, while the A allele remains as a 166 bp fragment. This dual confirmation strengthens confidence in the genotype calls.
The study found eight heterozygous FFS carriers among the 133 genotyped horses, corresponding to 6.02% of the total sample. No homozygous FFS horses were found, consistent with previous reports that homozygosity is lethal or rarely compatible with survival. Four carriers were Thoroughbreds and four were Warmbloods. The carrier frequency among sampled Thoroughbreds was 4/57, or 7.02%, which was significantly higher than a previously published Thoroughbred estimate of 17 carriers among 862 horses, or 1.97%. Fisher’s exact test gave OR = 3.75 and p = 0.036. The Warmblood carrier frequency was 4/70, or 5.71%, lower than a previously reported 11.0% but not significantly different, with OR = 0.49 and p = 0.234.
This carrier-frequency result is important but should not be overinterpreted. The study’s Thoroughbred sample was small and focused on sport horses actively training or competing in disciplines such as eventing, dressage, and show jumping. It may not represent all Thoroughbreds. The authors suggest that the higher observed frequency could reflect selection among Thoroughbreds used for sport disciplines rather than racing, breeding, or recreational purposes. This is a hypothesis, not proof. With only four Thoroughbred carriers, larger studies are needed before drawing firm conclusions about selection.
In the full 128-horse kinematic cohort, breed-group differences were tested. Scaled speed was the only parameter significantly different between Thoroughbreds and Warmbloods after Benjamini-Hochberg correction. Table 1 on page 33 reports that Thoroughbreds had a median scaled speed of 0.051 MT3/frame, while Warmbloods had a median of 0.055 MT3/frame, with P_BH = 0.020. Post hoc testing confirmed that Warmbloods trotted significantly faster than Thoroughbreds, with P_BH = 0.006 and rank-biserial correlation r = +0.35. The authors estimate that this roughly corresponds to Warmbloods moving about 0.25 m/s faster, based on metatarsal length and 120 fps video.
Table 1 also shows suggestive breed-group differences in stride length and duty factor. Warmbloods tended to have longer scaled stride length and lower duty factor than Thoroughbreds, but these did not survive FDR correction at the main threshold. This supports the idea that breed morphology and movement style can influence gait variables. That matters for the genetic analysis because if genotype groups differ by breed or facility, apparent genotype effects could actually reflect breed or environment. The authors therefore used a matched subset for the primary FFS-carrier comparison.
The matched subset included 20 horses: 8 FFS carriers and 12 wildtype controls. The controls were selected to match carriers by filming location, and when possible by training discipline and breed. All 20 horses had successfully appeared at FEI CCI1 to CCI3 level eventing competitions. This is a major design strength because filming location was found to matter. Facility conditions can affect gait through footing, handling, environment, training program, horse relaxation, and camera setup. Matching by location reduces the risk that differences are simply due to where the horses were filmed.
In this matched subset, the primary statistical model used ordinary least squares regression with genotype and filming location. The authors screened possible covariates including sex, breed group, and filming location. Breed effects were complicated by confounding with location because some locations included only Warmbloods or only Thoroughbreds. The final model retained filming location as a fixed effect. The authors corrected for eight simultaneous kinematic comparisons using the Benjamini-Hochberg false discovery rate procedure.
The main genotype result appears in Table 2 on page 34 and Figure 2 on pages 30 and 37. FFS carriers showed significantly higher duty factor than wildtype horses. The carrier median was 0.293 with IQR 0.284-0.313, while the wildtype median was 0.269 with IQR 0.242-0.285. The regression coefficient was +0.036 with SE 0.010, raw p = 0.003, P_BH = 0.021, and Cohen’s d = 0.91 with 95% confidence interval 0.16 to 1.89. This is the study’s strongest statistical evidence for a subclinical gait phenotype in FFS carriers.
Duty factor is biologically meaningful. A horse with a higher hindlimb duty factor keeps the hoof on the ground for a greater proportion of the stride cycle. In lame or painful horses, increased stance time can sometimes represent compensation. However, the horses in this study were overtly healthy and training or competing at high sport levels. The authors therefore interpret the finding not as evidence of clinical lameness, but as a possible signal of altered connective tissue compliance or proprioceptive compensation. That interpretation is plausible, but it remains a hypothesis.
The second genotype-related signal was hindlimb retraction ratio. Carriers had a median of 0.912 compared with 0.897 in wildtype horses. The raw p-value was 0.013, but after Benjamini-Hochberg correction the value was P_BH = 0.051, just above the conventional 0.05 threshold. Cohen’s d was 1.00 with 95% confidence interval 0.19 to 2.16. This means the effect size was large, but the corrected statistical evidence narrowly missed the predefined threshold. The responsible interpretation is that hindlimb retraction ratio is a strong trend worthy of further study, not a confirmed finding.
Figure 3 on pages 31 and 38 shows effect size estimates for all eight kinematic variables. The forest plot orders variables by absolute Cohen’s d and displays 95% bootstrap confidence intervals. Hindlimb retraction ratio and duty factor are the two largest positive effects for carriers relative to wildtype horses. Duty factor is marked as significant after BH correction, while hindlimb retraction ratio is marked as an uncorrected trend. The figure is valuable because it visually separates the strong signal from the weaker non-significant variables. Most other variables cluster near zero or have wide uncertainty.
No significant genotype effect was detected for scaled speed, stride length, fetlock range of motion, forelimb retraction ratio, forelimb swing range, or hindlimb swing range. This matters because the genotype effect was not a broad change in all movement parameters. It appeared most clearly in the time the right hindlimb spent in stance, with a possible related signal in hindlimb retraction. This specificity makes the finding more interesting but also means future studies need to confirm whether the effect is real, symmetrical across limbs, and consistent across gaits, surfaces, and disciplines.
Figure 4 on pages 32 and 39 presents Pearson correlation matrices for the eight kinematic variables in carriers and wildtype controls. The matrices show some shared relationships, such as strong correlations between scaled speed and stride length: r = 0.94 in carriers and r = 0.89 in wildtype horses. Scaled speed also correlated with hindlimb swing range in both groups, with r = 0.77 in carriers and r = 0.72 in wildtype horses. These relationships are expected because faster movement often comes with longer stride and different limb swing dynamics.
The correlation matrices also show potentially interesting genotype contrasts. For example, the relationship between forelimb swing range and forelimb retraction ratio appears positive in carriers but negative in wildtype horses. The authors do not overstate this because the groups are small, especially the carrier group with only eight horses. Still, the matrices suggest that FFS carrier status may influence not only individual variables but also how movement variables relate to one another. Larger samples would be needed to test this properly.
The biological interpretation centers on connective tissue compliance. PLOD1 affects lysyl hydroxylase 1, which contributes to collagen crosslinking. If carriers have subtly reduced collagen crosslinking, their tendons, ligaments, skin, or joint capsules might be slightly more compliant. In locomotion, this could influence stance duration, limb recoil, joint stabilization, proprioception, and energy storage. The observed increase in duty factor and trend toward higher hindlimb retraction ratio are consistent with that hypothesis, but the study does not directly measure collagen crosslinks, tendon stiffness, ligament compliance, joint laxity, or enzyme activity in the studied horses.
The paper also links the equine findings to human connective-tissue disorders. Pathogenic PLOD1 variants in humans cause kyphoscoliotic Ehlers-Danlos syndrome type VIA, a recessive condition associated with scoliosis, hypotonia, hyperflexible joints, and fragile skin. Human carriers of pathogenic PLOD1 variants may not show overt disease, but some studies report reduced lysyl hydroxylase enzyme activity. The authors use this background to argue that heterozygous states can plausibly have subtle physiological effects even without obvious disease. However, direct comparison between horses and humans must be cautious because species, genotype, tissue loading, and clinical consequences differ.
The study also raises a potentially sensitive question about selection. If FFS carriers have movement qualities perceived as desirable in some sport contexts, the allele could persist at higher-than-expected frequencies despite being lethal when homozygous. Previous literature has suggested that FFS carrier status may be associated with movement traits, conformation, or estimated breeding values in some Warmblood populations. The present study adds objective kinematic evidence suggesting that carrier status may correspond to altered gait mechanics. But it does not prove a performance advantage. A higher duty factor could be beneficial, neutral, or potentially risky depending on context.
This distinction is ethically important. A genotype associated with attractive movement should not be promoted without considering health and welfare. If carrier status affects connective tissue compliance, it could theoretically influence injury risk, joint stability, tendon function, or long-term soundness. The study explicitly states that it cannot determine whether carriers have increased injury risk. Because the sampled horses were active sport horses, individuals with severe career-ending problems may have been excluded by the sampling strategy. Future epidemiological studies in genotyped populations would be needed to test whether carriers are more or less prone to musculoskeletal injury.
The paper briefly discusses an even more serious concern: connective tissue effects may not be limited to limbs. In PLOD1 knockout mice, some homozygotes experienced sudden death associated with hemorrhage consistent with aortic dissection. Aortic dissection is rare in horses, and this study does not show that FFS carrier horses have vascular risk. The authors appropriately present this as a reason for further investigation, not as a claim that carrier horses are unsafe. The point is that if a collagen-crosslinking variant has systemic tissue effects, researchers should not focus only on athletic movement and ignore other tissues.
The study’s AI-assisted method is one of its major contributions. By using video rather than attached sensors or specialized lab platforms, the approach is field-deployable and scalable. Once trained, the model can process large numbers of video segments much more quickly than manual labeling. This matters for population genetics because subtle heritable locomotor traits require large datasets. A small biomechanics lab study might detect detailed motion in a few horses, but genomic association and breeding applications require hundreds or thousands of animals.
However, markerless AI gait analysis also has limitations. DeepLabCut depends on accurate landmark identification, and errors can arise from occlusion, handler movement, lighting, video angle, camera motion, coat color, tack, or limb overlap. The authors attempted to control this through high-frame-rate video, track setup, scaling, quality-control exclusions, and facility matching. Still, AI-derived kinematics should be validated against established biomechanical methods where possible, especially for subtle genotype effects.
Another limitation is that the current pipeline focused on the right hindlimb for several key parameters. The authors acknowledge that ongoing work will expand the pipeline to all four limbs. This is important because gait effects may be asymmetric or may involve forelimb-hindlimb coordination. A right-hindlimb duty factor signal is interesting, but a full biomechanical interpretation requires all limbs, bilateral symmetry, joint-specific range of motion, and possibly force or pressure data.
The small number of carriers is the most obvious limitation. Only eight FFS carriers were identified, and the main genotype analysis used 8 carriers and 12 controls. This is a reasonable exploratory matched design given the rarity of the allele, but it is not enough for final conclusions. The authors’ own power analysis estimates that detecting a hindlimb retraction ratio effect with 90% power would require at least 46 horses in the matched subset, including 18 carriers. Given the observed carrier rate, recruiting that many carriers might require screening approximately 372 sport horses.
The study also includes facility-level confounding. Filming location was significant for duty factor, suggesting that footing, handler, training program, horse state, or environmental factors influenced gait. This does not invalidate the genotype finding because the authors matched and blocked by location, but it shows how sensitive gait data can be to context. Future studies should standardize or carefully model footing, handler speed, lead tension, surface, warm-up, fatigue, and horse motivation.
The study’s conclusions should therefore be narrow. It does not prove that all FFS carrier horses move differently. It does not prove that carrier horses are lame, fragile, unsafe, superior athletes, or at higher injury risk. It does not justify breeding for the allele. It does not replace veterinary examination or genetic counseling. What it does show is that, in a small matched group of sport horses, FFS carriers had a measurable increase in hindlimb duty factor and a near-significant trend in hindlimb retraction ratio, both consistent with the hypothesis of altered connective tissue mechanics.
For horse owners and breeders, the practical message is caution rather than alarm. FFS carrier status already matters for breeding because mating two carriers can produce affected foals. This study adds the possibility that carrier status may also have subtle biomechanical consequences. But it is too early to use these findings as a basis for individual performance judgment, sale valuation, exclusion from sport, or health prediction. Genetic information should be interpreted with veterinary and breeding professionals, and broader welfare should remain central.
For sport-horse scientists, the study is exciting because it shows how genotype and movement data can be integrated at field scale. Instead of relying only on subjective scores, researchers can use AI-assisted kinematics to define precise endophenotypes such as duty factor, retraction ratio, swing range, and stride metrics. These can then be linked to genetic variants, performance records, injury outcomes, and breeding values. This opens the possibility of more objective equine movement genetics.
For animal welfare, the study highlights a broader principle: traits selected for performance may carry hidden biological trade-offs. A movement pattern that looks expressive or desirable could reflect changes in connective tissue mechanics. Those changes might be advantageous in one context and risky in another. Responsible breeding and sport management require understanding both performance and health consequences, not only selecting for visible movement quality.
The strongest result in the paper is the significantly increased duty factor in FFS carriers after correction for multiple comparisons. The most intriguing but not yet confirmed result is the hindlimb retraction ratio trend. The most important methodological contribution is the field-deployable AI-assisted video kinematic pipeline. The biggest weakness is the small carrier sample and limited right-hindlimb-focused analysis. The most responsible conclusion is that this preprint provides early evidence for a subclinical biomechanical phenotype in PLOD1 c.2032G>A heterozygous sport horses, but replication in larger, balanced, prospectively designed cohorts is essential.
Overall, the paper moves Fragile Foal Syndrome carrier research beyond simple carrier-frequency reporting. It asks whether a lethal recessive allele, when present in a single copy, may shape sport-horse movement in subtle ways. That question matters for genetics, biomechanics, performance, welfare, and breeding ethics. The study does not provide final answers, but it gives a strong reason to investigate FFS carrier locomotion more carefully using objective, scalable tools.
Source and Method Note
Source title: A Subclinical Biomechanical Phenotype Detected By AI-Assisted Video Gait Analysis in Horses Heterozygous for the Fragile Foal Syndrome Allele in PLOD1.
Authors: Madelyn P. Bucci, L. Savannah Dewberry, Elizabeth A. Staiger, Kyle Allen, and Samantha A. Brooks.
Publication / preprint / report status: This is an SSRN-hosted original research preprint / equine genetics and biomechanics manuscript. The PDF explicitly states that the manuscript has not been peer reviewed.
Peer-review status: Not peer reviewed. The findings should be interpreted as non-peer-reviewed preprint evidence and require cautious reading, independent replication, and peer-review evaluation.
Subject area: Equine genetics, Fragile Foal Syndrome, PLOD1, connective tissue biology, sport-horse biomechanics, AI-assisted video gait analysis, markerless pose estimation, DeepLabCut, and digital kinematics.
Methods used: The study combined genetic testing for the PLOD1 c.2032G>A Fragile Foal Syndrome allele with AI-assisted markerless video gait analysis. Horses were filmed trotting in hand at their home facilities. Videos were processed with DeepLabCut to label 26 anatomical landmarks, and custom scripts extracted eight kinematic parameters. Genotyping used PCR-RFLP and Sanger sequencing confirmation. Statistical methods included z-score quality control, Shapiro-Wilk normality testing, Kruskal-Wallis tests, Mann-Whitney U tests, Fisher’s exact tests, ordinary least squares regression, filming-location blocking, Benjamini-Hochberg false discovery rate correction, Cohen’s d effect sizes, bootstrap confidence intervals, and prospective power analysis.
Dataset and experimental structure: The total genotyped cohort included 133 privately owned mature sport horses aged 3 to 26 years. After quality-control exclusions, 128 horses were used for broad kinematic analysis: 56 Thoroughbreds, 67 Warmbloods, and 5 Other breed-group horses. Eight horses were identified as FFS carriers among the 133 genotyped horses. The primary genotype comparison used a location-matched subset of 20 FEI-level eventing horses: 8 FFS carriers and 12 wildtype controls.
Figures, tables, and page numbers: Figure 1 on pages 29 and 36 shows violin plots of eight kinematic variables by breed group in the full 128-horse cohort, highlighting a significant breed-group effect on scaled speed. Figure 2 on pages 30 and 37 shows split violin plots comparing carriers and wildtype controls across all eight kinematic variables. Figure 3 on pages 31 and 38 shows Cohen’s d effect-size estimates with bootstrap confidence intervals, identifying duty factor as significant after BH-FDR correction and hindlimb retraction ratio as a raw trend. Figure 4 on pages 32 and 39 shows Pearson correlation matrices for kinematic variables in carriers and wildtype controls. Table 1 on page 33 reports kinematic variables by breed group. Table 2 on page 34 reports genotype comparisons between carriers and wildtype horses.
Formula and statistical explanation: Duty factor represents the proportion of a stride cycle spent in stance for the right hindlimb. Retraction ratio was calculated as maximum retraction divided by maximum limb extension, providing a speed- and size-independent index of hoof flight path. Kinematic variables were scaled using third metatarsal length to account for body-size and camera-distance effects. Cohen’s d was calculated as Carrier − WT divided by pooled standard deviation, with positive values indicating higher values in carriers. Benjamini-Hochberg correction was used to control false discovery rate across eight kinematic comparisons.
Important caution: This article is an explanatory interpretation of a non-peer-reviewed preprint. It is not veterinary medical advice, not a diagnosis of any individual horse, not a breeding directive, not a genetic counseling replacement, not a performance guarantee, not an injury-risk certification, not an equestrian safety approval, not legal advice, not investment advice, not an engineering certification, not a religious ruling, and not an official policy order. Decisions about FFS testing, breeding, sport participation, veterinary evaluation, and horse welfare should be made with qualified veterinarians, geneticists, breeders, and equine professionals.