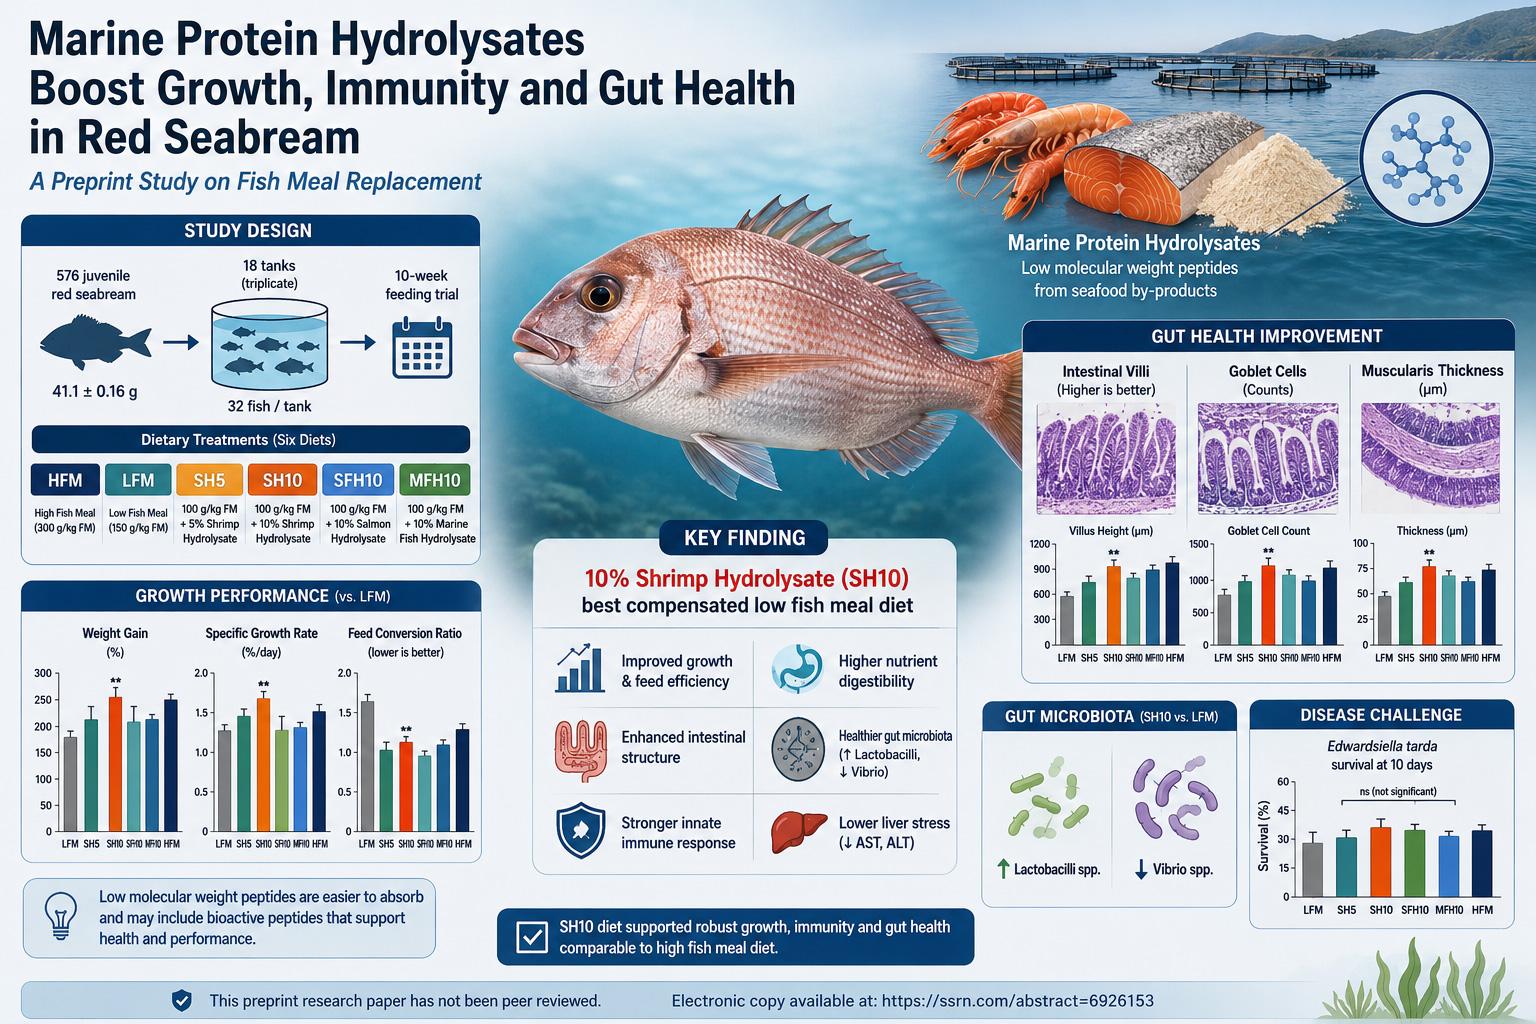
A non-peer-reviewed preprint study evaluates whether low molecular weight marine protein hydrolysates can compensate for reduced fish meal in juvenile red seabream diets. The researchers tested six diets over 10 weeks: a high fish meal control, a low fish meal control, and four low fish meal diets supplemented with shrimp, salmon, or marine fish hydrolysates. The strongest overall performance was observed in the diet containing 10% shrimp hydrolysate, which improved growth, feed efficiency, nutrient digestibility, innate immune markers, intestinal morphology, beneficial gut bacteria, and liver-related blood indicators compared with the low fish meal diet.
The study is important because fish meal is nutritionally valuable but expensive, limited in supply, and environmentally pressured. Aquaculture needs alternative ingredients that do more than merely replace crude protein; they must support digestion, immunity, gut structure, and fish health. This preprint suggests that hydrolysates enriched in small peptides, especially shrimp hydrolysate at 10% inclusion, may help red seabream use low fish meal diets more efficiently. However, because the work is a preprint and has not been peer reviewed, its findings should be interpreted as promising experimental evidence rather than final aquafeed guidance.
This study focuses on a central problem in modern aquaculture: how to reduce fish meal in carnivorous marine fish diets without compromising growth, health, feed efficiency, or product quality. Fish meal has long been considered a high-quality aquafeed ingredient because it contains digestible protein, balanced amino acids, attractive compounds, minerals, lipids, and bioactive molecules that many carnivorous fish use efficiently. Red seabream, a valued marine fish in South Korea and Japan, is one of the species for which high-quality protein nutrition is especially important.
The pressure to reduce fish meal is not simply economic. Fish meal can be costly, supply-limited, and tied to wild fisheries. As aquaculture expands, relying heavily on fish meal creates sustainability and cost concerns. Many alternative protein sources have been tested, including plant proteins, land-animal by-products, single-cell proteins, insect proteins, and marine by-products. But replacing fish meal is not as simple as matching crude protein percentages. A feed can have the same protein level on paper while still being less digestible, less palatable, imbalanced in essential amino acids, or more stressful to the gut.
Plant-derived ingredients often create this challenge. They can contain antinutritional factors, may be deficient in certain essential amino acids, and can affect gut function or nutrient absorption in carnivorous fish. In the present study, the low fish meal diet relied heavily on plant-derived protein sources such as wheat gluten and corn gluten. The authors therefore tested whether marine protein hydrolysates could restore some of the nutritional and functional value lost when fish meal was reduced.
Protein hydrolysates are produced when proteins are broken down into smaller peptides and free amino acids, usually through enzymatic hydrolysis. This process matters because intact proteins require digestion before absorption, while small peptides can be absorbed more readily through intestinal peptide transport systems. Marine protein hydrolysates may also contain bioactive peptide fragments with antioxidant, antimicrobial, immunomodulatory, or gut-supporting effects. In practical terms, a hydrolysate is not just another protein source; it can behave like a functional ingredient.
The study specifically emphasizes low molecular weight peptides. Low molecular weight peptides are smaller peptide fragments, often below 1000 Da, that may be easier for fish to absorb and more biologically active than larger protein fragments. The authors hypothesized that hydrolysates with a larger proportion of these small peptides would improve growth performance, nutrient utilization, and immune responses in red seabream. This is the main biological logic of the experiment: if fish receive a pre-digested, peptide-rich ingredient, they may extract nutrients more efficiently and maintain a healthier intestine.
The experiment used six diets. The high fish meal diet, abbreviated HFM, contained 300 g/kg fish meal and acted as the positive control. The low fish meal diet, abbreviated LFM, contained 150 g/kg fish meal and acted as the negative control. Four additional diets were based on an even lower fish meal level of 100 g/kg and supplemented with hydrolysates: SH5 contained 5% shrimp hydrolysate, SH10 contained 10% shrimp hydrolysate, SFH10 contained 10% salmon hydrolysate, and MFH10 contained 10% marine fish hydrolysate.
Table 1, on page 33, provides the diet formulation and proximate composition. This table is important because it shows that the diets were formulated to be isonitrogenous and isolipidic, meaning that they had similar crude protein and lipid levels. Crude protein was close to 49.8-49.96% and crude lipid was close to 13.11-13.22% across the diets. This means that the observed differences are not simply because one diet had more crude protein or fat. Instead, the differences likely relate to ingredient quality, peptide form, digestibility, bioactivity, palatability, amino acid delivery, and gut responses.
Table 2, on page 35, gives one of the study’s most important technical details: the molecular weight distribution of the three hydrolysates. Shrimp hydrolysate and marine fish hydrolysate had identical reported distributions, with 44.50% below 150 Da, 37.90% between 150 and 500 Da, and 9.50% between 500 and 1000 Da. This means that 91.9% of their peptides were below 1000 Da, and 82.4% were below 500 Da. Salmon fish hydrolysate had 42.70% below 150 Da, 26.80% between 150 and 500 Da, and 13.20% between 500 and 1000 Da, totaling 82.7% below 1000 Da and 69.5% below 500 Da. This difference helps explain why shrimp and marine fish hydrolysates generally performed better than salmon hydrolysate in several outcomes.
The feeding trial was conducted with 576 juvenile red seabream with an initial body weight of 41.10 ± 0.16 g. Fish were randomly allocated to 18 acrylic tanks of 240 L, with 32 fish per tank and three replicate tanks per dietary treatment. The feeding period lasted 10 weeks. Water quality was controlled, with temperature maintained at 20-24°C, dissolved oxygen at 7.8-8.8 mg/L, and salinity at 34-35 ppt. The experiment was approved by the Institutional Animal Care and Use Committee operated by Jeju National University.
The sample collection and analytical structure were broad. The researchers measured growth performance, survival, feed intake, feed conversion ratio, protein efficiency ratio, body indices, blood biochemical parameters, innate immune markers, antioxidant enzymes, digestive enzyme activity, gut microbiota, intestinal histomorphology, lipid-metabolism gene expression, nutrient digestibility, whole-body and muscle proximate composition, muscle amino acids, muscle fatty acids, and disease resistance after Edwardsiella tarda challenge. This makes the study more informative than a simple growth trial because it asks whether hydrolysates improve the biological system behind growth.
The growth results are clear. Table 6, on page 39, shows that the HFM group had the highest final body weight, weight gain, and specific growth rate. HFM reached a final body weight of 149.6 ± 2.8 g and weight gain of 263.5 ± 5.8%. The LFM group performed worse, with final body weight of 126.3 ± 1.8 g and weight gain of 207.3 ± 4.2%. This confirms that reducing fish meal without functional compensation impaired growth.
The hydrolysate results show that not all supplementation worked equally. SH10 reached a final body weight of 142.3 ± 3.9 g and weight gain of 246.3 ± 9.9%, statistically comparable to HFM for final body weight and weight gain but higher than LFM. MFH10 also improved growth, reaching 140.8 ± 3.1 g final body weight and 242.1 ± 7.8% weight gain. In contrast, SH5 and SFH10 were closer to LFM, with final body weights of 130.1 ± 1.7 g and 130.6 ± 4.5 g, respectively. This suggests that both hydrolysate source and inclusion level mattered.
Feed conversion ratio and protein efficiency ratio provide another layer of interpretation. Lower FCR means less feed was required to produce a unit of weight gain. SH10 had the lowest FCR at 1.20 ± 0.05, even slightly lower than HFM at 1.24 ± 0.04 and MFH10 at 1.24 ± 0.02. LFM had a worse FCR of 1.35 ± 0.03. Protein efficiency ratio was highest in SH10 at 1.68 ± 0.07, compared with 1.48 ± 0.04 in LFM. This means the shrimp hydrolysate diet did not merely increase body weight; it improved how efficiently consumed protein was converted into fish biomass.
The study’s digestibility data help explain the growth results. Apparent digestibility coefficients are shown in Table 12 on page 45. The LFM diet had the lowest digestibility values: dry matter 54.1%, protein 76.6%, lipid 75.1%, carbohydrate 39.9%, and energy 69.0%. SH10 markedly improved all of these: dry matter 69.4%, protein 85.7%, lipid 85.7%, carbohydrate 65.5%, and energy 81.5%. These are large differences. SH10 outperformed HFM in several digestibility measures, including dry matter, protein, lipid, carbohydrate, and energy.
This is one of the most meaningful findings in the paper. It suggests that a low fish meal diet supplemented with 10% shrimp hydrolysate can become more digestible than a high fish meal diet for several nutrient categories, at least under these experimental conditions. The likely explanation is that low molecular weight peptides reduce the digestive burden, improve absorption, and may enhance gut structure or transporter activity. The diet is not simply supplying protein; it is supplying protein in a form the fish can use efficiently.
Interestingly, digestive enzyme activities did not significantly differ among dietary groups. Table 9 on page 42 shows no significant changes in trypsin, chymotrypsin, and lipase activities, although the ANOVA value shown for lipase is 0.011 while the text states no significant changes among dietary groups. This apparent inconsistency deserves caution. The broader interpretation offered by the authors is that improved digestibility did not require increased digestive enzyme activity. Instead, the hydrolysates were already partially broken down and therefore easier to absorb.
The intestinal morphology results strongly support the gut-health interpretation. Table 11, on page 44, reports villus height, enterocyte height, muscularis thickness, and goblet cell counts. LFM had the lowest villus height at 805 ± 30 μm, while SH10 had the highest at 1064 ± 49 μm. MFH10 also performed well at 1014 ± 79 μm. Enterocyte height was 47.81 ± 2.80 μm in LFM, compared with 54.50 ± 2.87 μm in SH10 and 54.80 ± 2.17 μm in MFH10. Muscularis thickness was 54.36 ± 1.97 μm in LFM, compared with 77.20 ± 2.27 μm in SH10 and 72.10 ± 3.99 μm in MFH10. Goblet cell counts increased from 587 ± 52 in LFM to 1052 ± 84 in SH10 and 1042 ± 94 in MFH10.
These intestinal measurements matter because they connect feed composition to biological function. Taller villi can increase absorptive surface area. Taller enterocytes may indicate improved maturation and transport capacity. Greater muscularis thickness may support intestinal motility. More goblet cells may indicate a stronger mucus barrier, which helps protect the gut from pathogens, irritation, and dietary stressors. In practical aquaculture terms, a fish that digests nutrients better and maintains a stronger intestinal barrier is likely to be more resilient under farming conditions.
Figure 1, on page 51, shows representative intestinal histology images for the six dietary treatments. The images are stained cross-sections of the intestine at 40× magnification with a 200 μm scale bar. The HFM panel includes labels for villus height, enterocyte height, muscularis thickness, and goblet cells. The SH10 and MFH10 panels visually support the table results by showing more developed intestinal structures than the LFM panel. This figure is not merely decorative; it helps translate numeric histomorphology into tissue-level evidence.
The innate immunity results also favor hydrolysate supplementation, especially SH10. Table 7, on page 40, reports lysozyme, antiprotease, myeloperoxidase, nitro blue tetrazolium, superoxide dismutase, glutathione peroxidase, and catalase. SH10 had the highest lysozyme activity at 0.77 ± 0.02 μg/mL, compared with 0.50 ± 0.01 in LFM and 0.65 ± 0.10 in HFM. SH10 also had the highest MPO activity at 1.87 ± 0.02, compared with 1.40 ± 0.15 in LFM. NBT activity was highest in SH10 at 1.03 ± 0.03, compared with 0.61 ± 0.11 in LFM. SOD activity was also high in SH10 at 79.9 ± 1.23% inhibition, compared with 70.8 ± 0.24 in LFM.
These immune markers have specific meanings. Lysozyme contributes to antibacterial defense by damaging bacterial cell walls. Myeloperoxidase is linked to oxidative killing mechanisms in immune cells. NBT reflects respiratory burst activity, which indicates the ability of phagocytic cells to produce reactive oxygen species against pathogens. SOD helps control oxidative stress by converting superoxide radicals into less reactive molecules. The pattern suggests that SH10 improved innate immune readiness while also supporting antioxidant control.
However, the immune findings should not be overstated. Antiprotease, GPx, and catalase did not significantly differ among groups. This means the effect was not a universal increase across all immune and antioxidant pathways. The strongest changes appeared in lysozyme, MPO, NBT, and SOD. A careful interpretation is that shrimp hydrolysate at 10% strengthened selected innate immune and oxidative-response markers, not that it fully transformed the immune system.
Blood biochemical results suggest potential liver-protective or stress-reducing effects. Table 8, on page 41, shows that LFM had the highest AST at 76.5 ± 5.30 U/L and ALT at 24.6 ± 3.10 U/L. SH10 had much lower values: AST 41.9 ± 4.82 U/L and ALT 14.2 ± 2.29 U/L. MFH10 also had low AST and ALT values, 45.2 ± 6.52 and 16.0 ± 3.06, respectively. Since AST and ALT can rise when liver cells or tissues are stressed or damaged, lower levels may indicate better hepatic condition. The study’s interpretation is that hydrolysates may help reduce metabolic stress associated with low fish meal, high plant-protein diets.
Gut microbiota results add another important layer. Table 10, on page 43, reports total viable bacteria, Vibrio spp., Gram-negative bacteria, and Lactobacilli spp. SH10 had Lactobacilli spp. counts of 0.29 ± 0.02 × 10⁴ CFU/g, the highest among groups, while LFM had 0.19 ± 0.05. Vibrio spp. counts were 0.32 ± 0.05 × 10⁴ CFU/g in LFM, compared with 0.28 ± 0.04 in SH10, 0.21 ± 0.03 in SFH10, and 0.22 ± 0.03 in MFH10. The text states that SH10 increased Lactobacilli and reduced Vibrio abundance, although the table’s superscripts indicate the Vibrio reduction was clearest for SH5, SFH10, and MFH10 relative to LFM. This is a point where readers should pay close attention to table-level details rather than only the abstract.
Even with that caution, the microbiota pattern suggests that marine hydrolysates may shift the intestinal microbial environment in a more favorable direction. Lactobacilli are often associated with beneficial gut function, while Vibrio includes species that can be opportunistic pathogens in marine aquaculture. The study used culture-based selective plating, not high-throughput sequencing. This means it measured selected cultivable groups rather than the full microbiome. Future sequencing-based studies would be needed to understand broader community composition and functional microbial pathways.
The gene-expression results focus on lipid metabolism and transport. Figure 2, on page 52, shows relative expression of FAS, CPT, FABP, PPAR-α, and PPAR-β. The only gene that significantly differed among treatments was FABP, or fatty acid binding protein. FABP expression was significantly upregulated in HFM, SH10, and MFH10 compared with LFM. This fits the digestibility data because these same diets showed improved lipid digestibility. FABP helps transport fatty acids inside cells, so its upregulation may indicate improved intracellular handling of absorbed lipids.
The absence of significant changes in FAS, CPT, PPAR-α, and PPAR-β is also informative. It suggests that the hydrolysates did not broadly alter lipid synthesis, fatty acid oxidation, or major transcriptional regulators of energy metabolism at the mRNA level. Instead, the effect was more specific to fatty acid transport. This matters because improved lipid digestibility without broad disruption of lipid-metabolism genes may be nutritionally desirable.
The Edwardsiella tarda challenge experiment provides a more cautious outcome. The fish were injected with E. tarda at 1.2 × 10⁸ CFU/mL and monitored for 10 days. According to the results, survival did not significantly differ among dietary groups. However, all hydrolysate-supplemented groups had numerically higher survival, ranging from 44% to 50%, compared with 36% in LFM, with the highest survival at 50% in SH10. Figure 3, on page 53, shows the survival curves after bacterial injection. Mortality began after injection and stabilized from day 8 onward.
This challenge result is important because it prevents exaggerated claims. The immune markers improved, and survival numerically improved, but the disease-resistance outcome was not statistically significant. Therefore, the study cannot prove that hydrolysate supplementation significantly protects red seabream from E. tarda under the challenge conditions used. The authors suggest that the pathogen dose may have been too high or the feeding period too short to convert immune-marker improvements into statistically significant survival differences. That is plausible, but it remains a hypothesis.
Whole-body and muscle composition results were mostly stable. Tables 13 and 14, on pages 46 and 47, show no significant differences in dry matter, protein, lipid, or ash in whole body or muscle tissue. This means that improved growth did not come with major changes in proximate body composition. Table 15, on page 48, shows only limited differences in muscle amino acids, including arginine, alanine, and serine. Table 16, on page 49, shows some differences in muscle fatty acids, with HFM generally higher in certain fish meal-associated fatty acids such as C20:5 and C22:6. This is expected because the HFM diet contained more fish meal.
The stability of body composition is practically relevant. Aquafeed reformulation must not only increase growth; it must also preserve fish quality. The study suggests that hydrolysate supplementation did not adversely change basic whole-body or muscle proximate composition over the 10-week trial. However, the lower levels of some omega-3-related fatty acids in non-HFM groups indicate that fish meal reduction can still affect fatty acid profiles. Future diets may need to balance hydrolysates with lipid sources that maintain EPA and DHA quality.
The strongest overall performer was SH10, the diet with 10% shrimp hydrolysate in a low fish meal formulation. It improved growth close to high fish meal performance, reduced FCR, increased PER, produced the best digestibility profile, improved villus height and goblet cell counts, increased lysozyme, MPO, NBT, and SOD, lowered AST and ALT, increased Lactobacilli counts, and showed the highest numerical survival after E. tarda challenge. The study therefore supports 10% shrimp hydrolysate as the most promising ingredient among the tested hydrolysates.
Why might shrimp hydrolysate perform so well? The authors discuss several possibilities. First, shrimp hydrolysate had a very high proportion of peptides below 1000 Da and below 500 Da. Second, shrimp-derived materials may include bioactive peptides from hemocyanin and other crustacean proteins. Third, shrimp by-products may contain compounds that influence gut motility, epithelial health, mucus production, or immune signaling. The study cannot isolate which specific peptide or compound caused the effect, but it supports the idea that raw-material origin matters.
The marine fish hydrolysate also performed well, especially for growth, digestibility, intestinal morphology, and FABP expression. This makes sense because it had the same reported molecular weight distribution as the shrimp hydrolysate. Salmon hydrolysate, while still beneficial for some outcomes, was less consistently strong. Its lower proportion of very small peptides may partially explain this. But raw material composition, amino acid profile, hydrolysis conditions, and bioactive peptide sequences could also contribute.
The study is valuable because it connects sustainability with performance. Fishery and seafood processing by-products are often underused or wasted. Converting them into protein hydrolysates may reduce waste while creating high-value aquafeed ingredients. This links aquaculture nutrition with circular bioeconomy principles: instead of treating shrimp heads, salmon viscera, or pelagic fish by-products as low-value residues, they can be processed into functional feed components.
At the same time, several limitations must be clearly stated. First, this is a preprint and has not been peer reviewed. Second, the feeding trial lasted 10 weeks and used juvenile red seabream under controlled tank conditions. Results may differ in larger fish, commercial sea cages, different water temperatures, different pathogen pressures, or longer production cycles. Third, the experiment used three replicate tanks per treatment, which is common in aquaculture nutrition but still limits statistical power for complex outcomes such as disease resistance.
Fourth, the study does not identify the exact bioactive peptide sequences responsible for the effects. It characterizes molecular weight distribution, but peptides of the same size can have very different biological activities depending on amino acid sequence. Fifth, the microbiota analysis used culture-based methods targeting selected bacterial groups. This provides useful but limited information compared with full microbiome sequencing. Sixth, the challenge test did not show statistically significant survival differences, so claims about disease resistance should remain cautious.
Another important limitation is that the best inclusion level may not be universal. SH10 worked well in this study, but higher levels could potentially reduce palatability, alter amino acid balance, cause bitterness, increase cost, or create metabolic inefficiencies. The authors themselves note that future work should investigate adverse threshold levels of low molecular weight peptide inclusion. In other words, “more hydrolysate” is not automatically better.
For feed manufacturers, the study suggests that peptide size distribution should be treated as a quality parameter. It may not be enough to label an ingredient as “fish hydrolysate” or “marine hydrolysate.” The molecular weight profile, raw material source, hydrolysis process, amino acid composition, palatability, and bioactive function may all determine performance. A hydrolysate rich in peptides below 1000 Da may behave differently from a broad hydrolysate containing larger peptide fractions.
For fish farmers, the practical message is that fish meal replacement should be evaluated through growth, feed conversion, gut health, immune status, and fish quality together. A low fish meal diet that saves money but reduces digestibility or immunity may not be economically efficient in the long term. A functional hydrolysate may increase ingredient cost but improve feed efficiency, health resilience, and growth performance. The economic outcome would depend on ingredient price, feed conversion improvement, survival, market size, and production conditions.
For environmental sustainability, the study points toward a more nuanced future. Reducing fish meal can reduce pressure on fish meal supply, but alternative ingredients must still support fish welfare. Marine by-product hydrolysates may offer a bridge between sustainability and performance by using side streams from seafood processing. However, the sustainability benefit depends on processing energy, sourcing, transport, price, and whether the by-products would otherwise be wasted or used elsewhere.
The most responsible interpretation of this study is that low molecular weight marine protein hydrolysates, especially 10% shrimp hydrolysate, show strong potential as functional fish meal substitutes in juvenile red seabream diets. The evidence supports improvements in growth, feed efficiency, digestibility, intestinal structure, selected immune markers, liver-related blood enzymes, and gut microbial balance. The evidence is weaker for statistically significant disease-resistance improvement because the E. tarda challenge survival difference was numerical but not significant.
Overall, this preprint contributes to aquaculture nutrition by showing that fish meal replacement should not be viewed only as a crude protein substitution problem. The form of protein matters. Peptide size matters. Gut structure matters. Immune readiness matters. Nutrient absorption matters. A successful alternative ingredient must help the fish function biologically, not merely satisfy a feed formulation spreadsheet. In this study, 10% shrimp hydrolysate came closest to doing that.
Source and Method Note
Source title: Low molecular weight marine protein hydrolysates as fish meal substitutes enhance growth, nutrient digestibility, innate immunity and gut health in red seabream (Pagrus major).
Authors: Saumya Poorni, Sanghyun Song, Thomas Levallois, and Kyeong-Jun Lee.
Publication / preprint / report status: This is an SSRN-hosted preprint research paper. The PDF explicitly states that the manuscript has not been peer reviewed.
Peer-review status: Not peer reviewed. The findings should be interpreted as non-peer-reviewed preprint evidence and require cautious interpretation until peer review, replication, and commercial-scale validation are available.
Subject area: Aquaculture nutrition, fish meal replacement, marine protein hydrolysates, juvenile red seabream, nutrient digestibility, innate immunity, gut microbiota, intestinal morphology, and disease challenge testing.
Methods used: The study used a 10-week feeding trial with six experimental diets, proximate composition analysis, amino acid and fatty acid profiling, innate immunity assays, antioxidant enzyme assays, digestive enzyme measurements, selective culture-based gut microbiota analysis, intestinal histomorphology, RT-qPCR analysis of lipid-metabolism-related genes, chromic oxide-based apparent digestibility coefficient calculations, and Edwardsiella tarda bacterial challenge testing.
Dataset and experimental structure: A total of 576 juvenile red seabream with an initial body weight of 41.10 ± 0.16 g were distributed into 18 tanks, with 32 fish per tank and three replicate tanks per treatment. The six diets were HFM, LFM, SH5, SH10, SFH10, and MFH10. The hydrolysates were shrimp hydrolysate, salmon fish hydrolysate, and marine fish hydrolysate, each characterized by molecular weight distribution.
Tables and figures: Table 1 on page 33 shows feed formulation and proximate composition of the six diets. Table 2 on page 35 shows the molecular weight distributions of the three hydrolysates, highlighting that shrimp and marine fish hydrolysates contained 91.9% peptides below 1000 Da and salmon hydrolysate contained 82.7% below 1000 Da. Tables 3 and 4 on pages 36-37 show dietary amino acid and fatty acid profiles. Table 6 on page 39 reports growth performance and feed utilization. Table 7 on page 40 reports innate immune and antioxidant markers. Table 8 on page 41 reports blood biochemical parameters. Table 9 on page 42 reports digestive enzyme activities. Table 10 on page 43 reports gut microbiota counts. Table 11 on page 44 reports intestinal histomorphology. Table 12 on page 45 reports apparent digestibility coefficients. Tables 13-16 on pages 46-49 report whole-body composition, muscle composition, muscle amino acids, and muscle fatty acids. Figure 1 on page 51 shows intestinal morphology images. Figure 2 on page 52 shows relative gene expression, especially FABP upregulation. Figure 3 on page 53 shows survival after Edwardsiella tarda challenge.
Formula and statistical explanation: The study calculates apparent digestibility coefficients using chromic oxide as an inert marker. The general ADC formula compares chromic oxide concentration in diet and feces, while nutrient-specific ADC also accounts for nutrient concentration in diet and feces. The study also uses one-way ANOVA and Tukey’s HSD test at P < 0.05. RT-qPCR gene expression was reported as fold change relative to the LFM group after normalization to 18S rRNA.
Important caution: This article is an explanatory interpretation of a non-peer-reviewed preprint. It is not veterinary advice, not a fish-health treatment recommendation, not an aquafeed certification, not a commercial feed approval, not an environmental certification, not legal advice, not investment advice, not an engineering approval, not a religious ruling, and not an official policy order. Feed formulation and fish-health decisions should be made with qualified aquaculture nutritionists, veterinarians, regulatory guidance, and species-specific commercial validation.