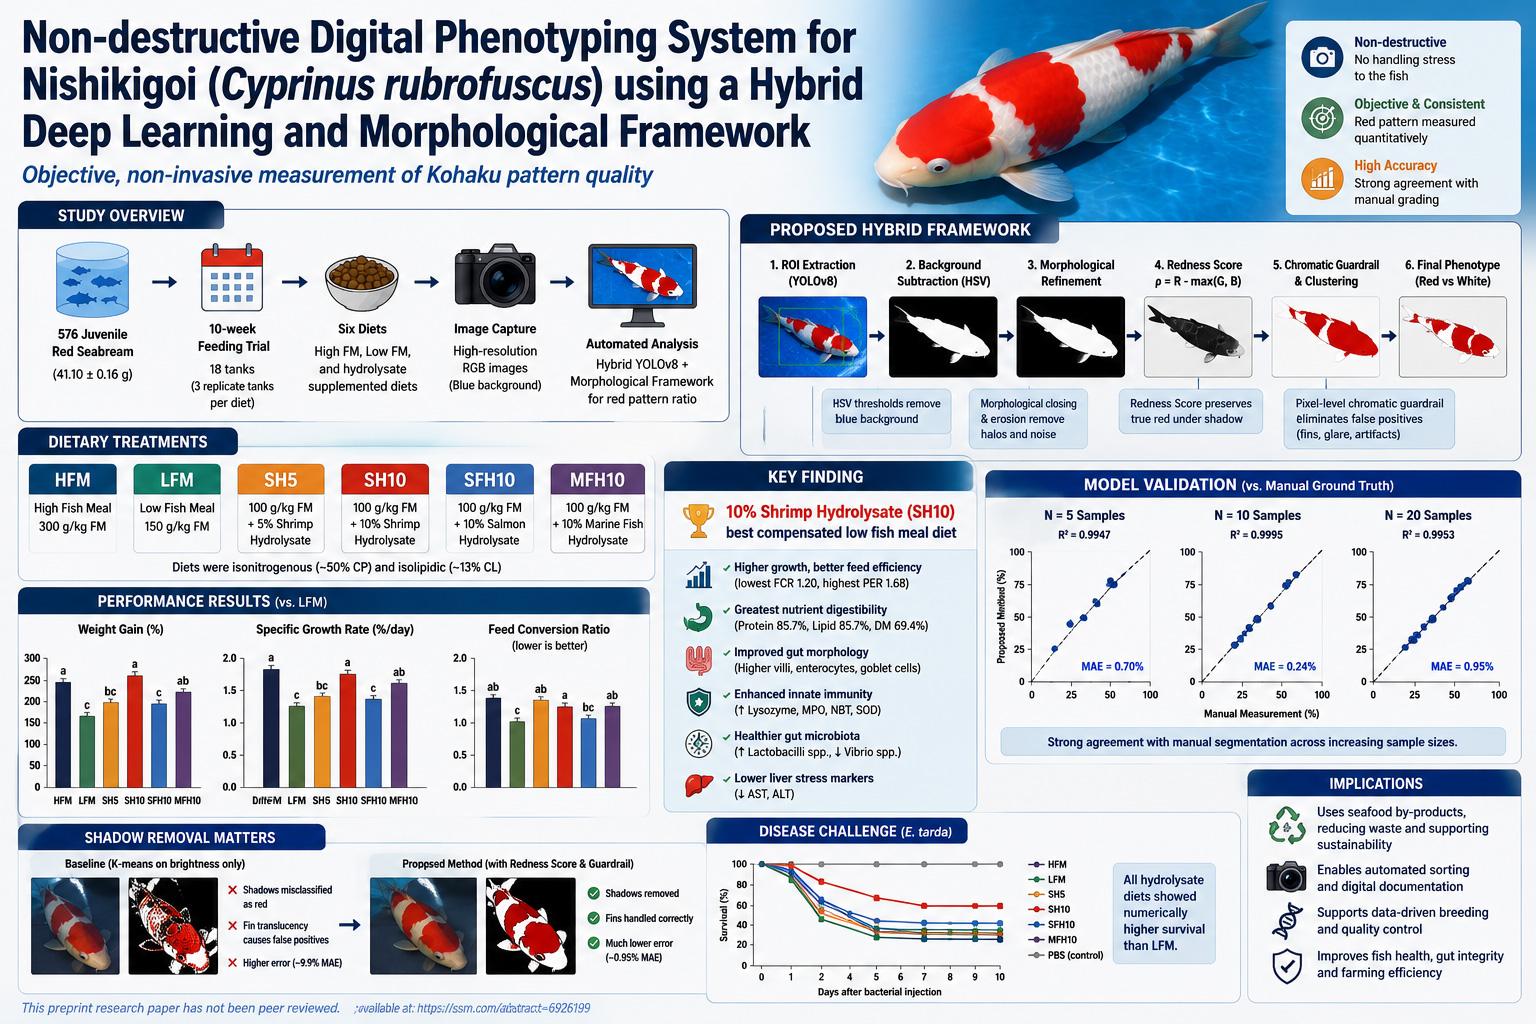
A non-peer-reviewed preprint study proposes a computer vision framework for objectively measuring the red-and-white colour pattern of Kohaku Nishikigoi, the iconic ornamental koi variety valued for red Hi markings on a white Shiroji background. The system combines a lightweight YOLOv8 detector for fish localization with deterministic image-processing steps, including HSV background subtraction, morphological mask refinement, shadow removal, a custom Redness Score, K-means clustering, and a Pixel-Level Chromatic Guardrail designed to prevent shadows, glare, translucent fins, and small artifacts from being mistaken for true pigmentation.
The study is important because Nishikigoi grading is traditionally based on expert visual judgment, which can be subjective, labour-intensive, and physically stressful for fish when manual handling is required. The proposed pipeline aims to make phenotyping more objective and non-destructive by extracting quantitative red pattern ratios from ordinary RGB images. In validation against manually segmented ground truth, the authors report strong agreement: R² values of 0.9947 for 5 samples, 0.9995 for 10 samples, and 0.9953 for 20 samples, with a final Mean Absolute Error of 0.95%. However, because this is a preprint and the validation dataset is limited, the method should be read as promising technical evidence rather than a fully established commercial grading standard.
This study addresses a practical and technologically interesting problem in ornamental aquaculture: how can the visual quality of Nishikigoi be measured objectively without touching or stressing the fish? Nishikigoi, especially the Kohaku variety, are valued not primarily for production traits such as meat yield, but for aesthetic traits. In Kohaku, the core visual phenotype is the contrast between red pigmentation, known as Hi, and the white base, known as Shiroji. The balance, coverage, edge quality, and spatial distribution of these colour regions strongly influence grading, breeding decisions, and market value.
The authors frame Nishikigoi as both a cultural and commercial subject. The paper notes that Nishikigoi originated in Niigata Prefecture and have become part of a global ornamental fish market. It states that Japan’s export market is valued at more than 6 billion JPY annually and that demand comes from collectors in regions including Europe, North America, and Southeast Asia. This matters because even small improvements in grading consistency may have economic value. A fish’s phenotype can affect its price, breeding use, export trust, and long-term documentation.
The traditional grading process depends heavily on expert visual evaluation. Expert judgment is valuable because experienced breeders and judges can perceive subtle quality signals that simple measurements may miss. However, human grading is subjective and can vary between evaluators. It is also not easily scalable. If a farm needs to evaluate many juveniles, repeated manual inspection can become slow and labour-intensive. More importantly, handling fish for inspection can harm welfare. Netting and physical manipulation may disrupt the protective mucus layer, increase physiological stress, and make fish more vulnerable to infection or devaluation.
The study therefore proposes a non-destructive digital phenotyping system. “Non-destructive” here means that the fish does not need to be physically handled or harmed for measurement. A camera captures the image, and the algorithm calculates objective pattern metrics. This connects the ornamental fish industry to a broader movement in precision agriculture and aquaculture, where visual phenotypes are increasingly measured through computer vision rather than manual scoring.
The technical challenge is harder than it may sound. Measuring red and white areas on a koi image is not simply a matter of selecting red pixels. Aquatic imaging introduces glare, turbidity, reflections, body curvature, fins with partial translucency, and shadows. In Kohaku images, a shadowed white region can look dark, while deep red pigmentation under shadow can lose brightness. A naïve brightness-based algorithm can therefore confuse three different things: true red pigment, dark shadow, and background or fin artifacts. The paper’s main technical contribution is a hybrid system designed specifically to reduce these errors.
The authors choose a hybrid framework rather than a fully end-to-end deep learning segmentation model such as Mask R-CNN. Their reasoning is engineering-oriented. End-to-end segmentation models can be powerful, but they often act as black boxes, require larger labelled datasets, and demand more computation. The proposed system instead uses deep learning only for attention and localization, then uses interpretable image-processing rules for the actual pigment segmentation. This design is meant to be lighter, more transparent, and more suitable for low-cost edge devices in aquaculture settings.
The dataset consisted of 100 high-resolution images of Kohaku Nishikigoi, sourced from an open-access Kaggle repository. Kohaku was selected because its bicolour phenotype makes it a clear validation target: red pattern on white background. The images were taken against a blue background, a common visual setup in Japanese aquaculture because blue enhances contrast with the red and white fish body. The dataset included variation in fish orientation, slight turbidity, lighting angle, surface reflection, and self-shadowing. These variations make the task more realistic than a perfectly controlled studio dataset, but the dataset remains limited and does not represent all field conditions.
The first step of the algorithm is ROI extraction and background subtraction. ROI means Region of Interest: the part of the image containing the fish. The paper uses a lightweight YOLOv8 nano model to draw a bounding box around the fish. This step prevents the algorithm from processing the entire image globally, where tank edges, pipes, bubbles, water texture, or background noise could interfere. YOLOv8 therefore acts as a dynamic attention mechanism. It does not decide the red pattern; it simply tells the rest of the pipeline where to look.
Inside the ROI, the image is converted from RGB to HSV colour space. This is a critical choice. RGB represents colour through red, green, and blue intensities, but it mixes colour information with brightness. HSV separates hue, saturation, and value. In underwater or aquatic photography, where illumination can vary and red light can attenuate, separating chromaticity from luminance helps make colour segmentation more robust. The system uses HSV thresholds to remove the blue background: H in the range 95-160, S in the range 100-255, and V in the range 80-255 are treated as background, while other pixels become potential foreground.
Figure 1 on page 11 visualizes this pipeline. The first panel shows the original koi image with a YOLO bounding box. The second panel shows the refined ROI mask, where the fish body is separated from the background. The third panel shows the final segmented phenotype, where red pattern regions are separated from the white base. This figure is central because it makes the workflow understandable: the system goes from image localization, to fish-body masking, to colour-pattern reconstruction.
The second step is the study’s main novelty: shadow and halo removal. The authors identify a common failure mode in underwater fish images. The dorsal ridge, body curvature, and overhead lighting can produce shadows that are dark enough to confuse segmentation algorithms. At the same time, the fish-water boundary can create halos and semi-transparent edge artifacts, especially around fins. These are not true phenotype regions, but an algorithm may misclassify them as pigment if it relies only on brightness or simple clustering.
The pipeline first applies morphological closing with a 5 × 5 kernel to fill small holes in the mask. Morphological closing is a standard image-processing operation: dilation followed by erosion. It helps connect nearby foreground regions and smooth small internal gaps. The system then uses erosion with a 3 × 3 kernel for two iterations to “shave” the boundary of the mask. This is meant to remove semi-transparent halo artifacts caused by light diffraction at the fish-water interface. In everyday language, the algorithm slightly trims the edge so that ambiguous edge pixels do not contaminate the phenotype measurement.
The authors then introduce a custom Redness Score, written as ρ = R - max(G, B). This formula is simple but important. It asks whether the red channel is stronger than both green and blue. If a pixel is truly red, the red value should dominate. If it is merely a neutral shadow, all channels may be dark together, and the Redness Score will remain low. This allows the algorithm to distinguish deep red pigment under shadow from neutral darkness. In other words, the system tries to look at chromatic dominance rather than brightness alone.
This is a clever engineering idea because it addresses a specific biological-visual problem. Bright red and dark red may look far apart in raw RGB intensity because one is brighter than the other. But both may share red-channel dominance. A shadowed white region, by contrast, may be dark but not red-dominant. The Redness Score therefore gives the algorithm a way to preserve pigment integrity under uneven lighting.
The third step is colour quantisation and a Pixel-Level Chromatic Guardrail. After applying a bilateral filter, the ROI pixels are segmented with K-means clustering using k = 3. A bilateral filter is useful because it smooths texture while preserving edges, so scale texture and noise can be reduced without blurring pattern boundaries too much. K-means then groups pixels into three colour-related clusters. However, clustering alone can still make mistakes, especially with small artifacts, translucent fins, or glare.
The Pixel-Level Chromatic Guardrail is designed to prevent those mistakes. Any pixel assigned to the red cluster must independently satisfy the Redness Score threshold of ρ ≥ 30. If it does not, the pixel is reassigned to the white Shiroji background. This guardrail matters because it prevents the clustering model from calling a pixel red merely because of statistical proximity. The pixel must also pass a physically interpretable colour condition.
The system also removes small disconnected components below 150 pixels. This is important for bubbles, glare spots, fin-edge artifacts, and chromatic aberrations that may appear as tiny false regions. The authors also replace square structuring elements with elliptical kernels to better preserve biological curvature. This is a meaningful detail because fish patterns are not rectangular. Elliptical morphology is more consistent with natural body and pattern shapes.
The final trait calculation is based on surface area coverage. The system calculates the red ratio by dividing the number of corrected red pixels by the total fish pixel area. This red ratio is a quantitative phenotype. It does not fully replace expert aesthetic judgment because it does not measure all qualities judges care about, such as skin depth, brilliance, future pattern development, kiwa/sashi edge quality, body conformation, or overall balance. But it creates an objective baseline measurement that can be repeated consistently.
The validation protocol compared automated measurements with manual ground truth segmentation. From the total dataset of 100 images, manual segmentation was performed in GIMP for validation subsets. The paper first describes a randomized ground truth validation using n = 5 specimens, and then reports expanded validation at N = 10 and N = 20. Manual pixel counts served as the baseline for calculating Mean Absolute Error and R². Mean Absolute Error measures how far the automated red ratio is from the manual red ratio on average. R² measures how tightly the automated and manual measurements follow a linear relationship.
The quantitative results are strong within the reported validation setting. In the first validation stage using 5 specimens, the system reached R² = 0.9947 with a Mean Absolute Error of 0.70%. Figure 2 on page 16 shows the regression plot for this sample size. The points lie close to the ideal one-to-one line, suggesting that automated and manual measurements were very similar for those images.
When the validation sample increased to 10 specimens, the reported R² increased to 0.9995 and MAE decreased to 0.24%. Figure 3 on page 16 shows this second regression analysis. The authors interpret this as evidence that the algorithm handled standard pattern variation without overfitting to a few fish. The very high R² is impressive, but it should also be interpreted cautiously because the validation sample remains small and the images come from one visual domain.
The extended validation using 20 specimens is the most important reported performance test. Figure 4 on page 17 shows the regression analysis for N = 20. The system achieved R² = 0.9953 and a final Mean Absolute Error of 0.95%. The authors describe this as operationally realistic and attribute the slight increase in error partly to human subjectivity around translucent fin boundaries. This result suggests strong agreement between the proposed algorithm and manual segmentation, but it does not yet prove broad field robustness across farms, cameras, water conditions, and koi varieties.
The paper then compares the proposed method with a baseline approach using standard K-means clustering based only on brightness without chromatic correction. This comparison is crucial because it isolates the value of the shadow-removal logic. Figure 5 on page 18 shows a comparative boxplot. The baseline method had an average absolute error of approximately 9.9%, while the proposed method reduced MAE to 0.95%. The boxplot also shows that the proposed method had a much smaller interquartile range, meaning performance was more consistent across images.
This comparison supports the authors’ central engineering claim: shadow removal is not an optional cosmetic improvement; it is the difference between a noisy system and a potentially usable phenotyping tool. If shadows are not handled correctly, an algorithm may misclassify dark red pigment as shadow or neutral shadow as red pigment. The Redness Score and guardrail reduce that risk by using chromatic dominance rather than brightness alone.
Figure 6 on page 19 presents a Bland-Altman analysis for the N = 20 validation. The authors report a negligible mean bias of 0.17%. Bland-Altman analysis is useful because correlation alone can be misleading; two methods can correlate well while one consistently overestimates or underestimates. A small mean bias suggests that the automated method did not systematically over- or under-measure red ratio relative to manual segmentation in this validation set.
The paper identifies four mechanisms behind algorithmic success. First, YOLOv8 localization isolates the fish from environmental noise before pixel-level measurement. Second, the Redness Score projects colour information into a red-dominance measure that can preserve deep pigment under shadow. Third, the Pixel-Level Chromatic Guardrail and morphological filtering remove bubbles, fin artifacts, and small disconnected noise. Fourth, the framework remains computationally light because it relies on basic morphology and linear operations rather than heavy segmentation networks.
The computational-lightness argument is especially relevant for aquaculture. A system that requires expensive GPUs or cloud computation may be difficult to deploy at small and medium-scale facilities. The authors suggest that their framework could run on low-power edge devices such as NVIDIA Jetson or Raspberry Pi. If true under real operating conditions, that would make digital phenotyping more accessible. However, the paper does not provide detailed runtime benchmarks, hardware tests, or throughput measurements, so the edge-deployment claim remains plausible but not fully validated.
The authors discuss three potential applications for smart aquaculture. The first is automated sorting. A camera-based gate system could evaluate juveniles without manual netting and sort fish according to thresholds such as red ratio. This could reduce labour and handling stress. The second is quantitative genetics. If breeders can track red-to-white ratio, pattern symmetry, edge sharpness, and other measurable pattern traits across generations, they can estimate heritability and make breeding decisions from objective data rather than intuition alone. The third is digital certification. A high-value Nishikigoi could receive a digital passport recording pattern metrics and a pattern map at the time of sale.
These applications are interesting, but they should be separated from what the study directly proves. The study validates red-ratio measurement on a limited Kohaku image dataset. It does not yet demonstrate a functioning automated sorting conveyor, a genetic-selection program, a blockchain certification system, or buyer-market outcomes. Those are reasonable future directions, not completed achievements.
The study’s strengths include a clear practical problem, an interpretable hybrid architecture, a biologically relevant treatment of shadows and red pigmentation, quantitative comparison with manual segmentation, and explicit discussion of limitations. The framework is also attractive because it does not require complex multispectral cameras or expensive imaging rigs. It attempts to extract useful phenotypes from ordinary RGB images, which could be more realistic for farms.
The limitations are equally important. First, the paper is a preprint and has not been peer reviewed. Its claims have not yet undergone formal external evaluation. Second, the dataset is small: 100 images, with validation reported on up to 20 specimens. Third, the images are limited to Kohaku koi against a blue background. The method is not yet proven for tricolour varieties such as Sanke or Showa, where black Sumi pigmentation could be confused with deep shadows. The authors acknowledge this directly.
Fourth, the validation relies on manual segmentation as ground truth. Manual segmentation itself can be subjective, especially at pattern boundaries, translucent fins, glare zones, and ambiguous colour transitions. If human labels vary, the evaluation baseline is not absolute. Future studies should include multiple expert annotators, inter-rater agreement, and consensus masks. Fifth, the study does not report Dice or Jaccard segmentation overlap values for the final masks, even though the literature review discusses these metrics. Red-ratio agreement is useful, but it does not fully reveal whether the spatial pattern map is correct. Two segmentations can have similar red area percentages but different pattern locations.
Sixth, the system is validated under controlled blue-background conditions. Real farm environments may include outdoor ponds, mud ponds, variable sunlight, strong turbidity, moving fish, surface ripples, water depth differences, camera angle shifts, and partial occlusion. A robust commercial system would need to handle video, motion blur, changing distance, fish rotation, overlapping fish, and imperfect tank backgrounds. The current study is a promising image-based prototype, not yet a complete field-deployed system.
Seventh, the system measures colour-area ratios but does not yet assess deeper Nishikigoi quality dimensions. Expert grading considers body conformation, skin lustre, colour depth, pattern balance, edge quality, future development potential, and variety-specific aesthetic standards. The authors mention that current computer vision models struggle to quantify colour depth and brilliance. Future work may require multi-angle imaging, polarization filters, spectral imaging, or standardized lighting calibration.
The broader scientific meaning of the paper is that ornamental aquaculture can benefit from the same digital phenotyping revolution already underway in plant science, livestock, and food production. When phenotypes are measured quantitatively, they can be tracked, compared, used in breeding models, and audited. This could move part of Nishikigoi assessment from purely subjective evaluation toward a mixed system: expert judgment supported by objective metrics.
The most useful everyday interpretation is simple: the system is not trying to replace the cultural expertise of koi breeders and judges. Instead, it tries to measure one important aspect of the phenotype consistently and without touching the fish. A red ratio or pattern map cannot capture the full beauty of a Kohaku. But it can reduce ambiguity in documentation, support early sorting, and create repeatable data for breeding and sales records.
If future studies validate the method on larger, independently collected datasets, the technology could help farms reduce handling stress, improve welfare, standardize grading records, and support data-driven breeding. It could also help buyers by documenting a fish’s appearance at a specific time under specified imaging conditions. But for now, the results should be read as a promising proof-of-concept rather than a certified commercial grading solution.
The strongest result in the paper is the reduction of error from about 9.9% in a luminance-only baseline to 0.95% in the proposed shadow-resistant method. That directly supports the paper’s main technical claim: underwater shadow artifacts are a major obstacle, and chromatically informed shadow removal can substantially improve Kohaku red-pattern measurement. The most cautious conclusion is that the hybrid YOLOv8 and morphological framework offers a transparent and computationally efficient path toward non-invasive Nishikigoi phenotyping, but it needs broader validation before being treated as an industry standard.
Source and Method Note
Source title: Non-destructive digital phenotyping system for Nishikigoi (Cyprinus rubrofuscus) using a hybrid deep learning and morphological framework.
Authors: Almaz Turginbekov, Assylkhan Alzhanov, Mukhamed Tolegenov, and Hideo Hasegawa.
Publication / preprint / report status: This is an SSRN-hosted preprint research paper / technical computer vision manuscript. The PDF explicitly states that the manuscript has not been peer reviewed.
Peer-review status: Not peer reviewed. The findings should be interpreted as non-peer-reviewed preprint evidence and require cautious reading until independent peer review, replication, and broader field validation are available.
Subject area: Computer vision, precision aquaculture, ornamental fish phenotyping, Nishikigoi grading, Kohaku colour segmentation, YOLOv8 object detection, mathematical morphology, shadow removal, and non-invasive digital measurement.
Methods used: The study used a hybrid image-processing framework consisting of YOLOv8 nano-based ROI localization, HSV colour-space background subtraction, morphological closing and erosion, bilateral filtering, K-means clustering with k = 3, a custom Redness Score defined as ρ = R - max(G, B), Pixel-Level Chromatic Guardrail thresholding with ρ ≥ 30, connected-component filtering for artifacts smaller than 150 pixels, and red-ratio calculation from corrected pixel counts.
Dataset and experimental structure: The study used 100 high-resolution images of Kohaku Nishikigoi sourced from an open-access Kaggle repository. Kohaku was selected because its red Hi patterns on white Shiroji background provide a clear bicolour validation target. The images were taken against a blue background and included variation in orientation, lighting, turbidity, surface reflection, and self-shadowing.
Figures and page numbers: Figure 1 on page 11 shows the proposed phenotyping pipeline: original fish image with YOLO bounding box, refined ROI mask after morphological processing, and final segmented phenotype separating red pattern and white base. Figures 2 and 3 on page 16 show linear regression validation for sample sizes 5 and 10, with reported R² values of 0.9947 and 0.9995. Figure 4 on page 17 shows validation for sample size 20 with R² = 0.9953. Figure 5 on page 18 compares baseline luminance-only segmentation error with the proposed shadow-removal method, showing MAE reduction from about 9.9% to 0.95%. Figure 6 on page 19 presents a Bland-Altman analysis with a reported mean bias of 0.17%.
Formula and statistical explanation: The key colour formula is the Redness Score, ρ = R - max(G, B), which measures red-channel dominance over green and blue. The final red ratio is calculated from the number of corrected red pixels divided by the total fish pixel area. Validation metrics include Mean Absolute Error for red-ratio difference, R² for automated-versus-manual measurement correlation, and Bland-Altman bias for agreement assessment. The manuscript discusses Dice and Jaccard metrics in the literature review, but the main reported validation results are MAE, R², and Bland-Altman bias.
Important caution: This article is an explanatory interpretation of a non-peer-reviewed preprint. It is not a commercial grading certification, not an official Nishikigoi judging rule, not animal-health advice, not an aquaculture regulatory approval, not a breeding guarantee, not investment advice, not legal advice, not an engineering certification, not a safety approval, not a religious ruling, and not an official policy order. Practical use of such systems should be validated under real farm conditions and interpreted alongside expert aquaculture and Nishikigoi grading knowledge.