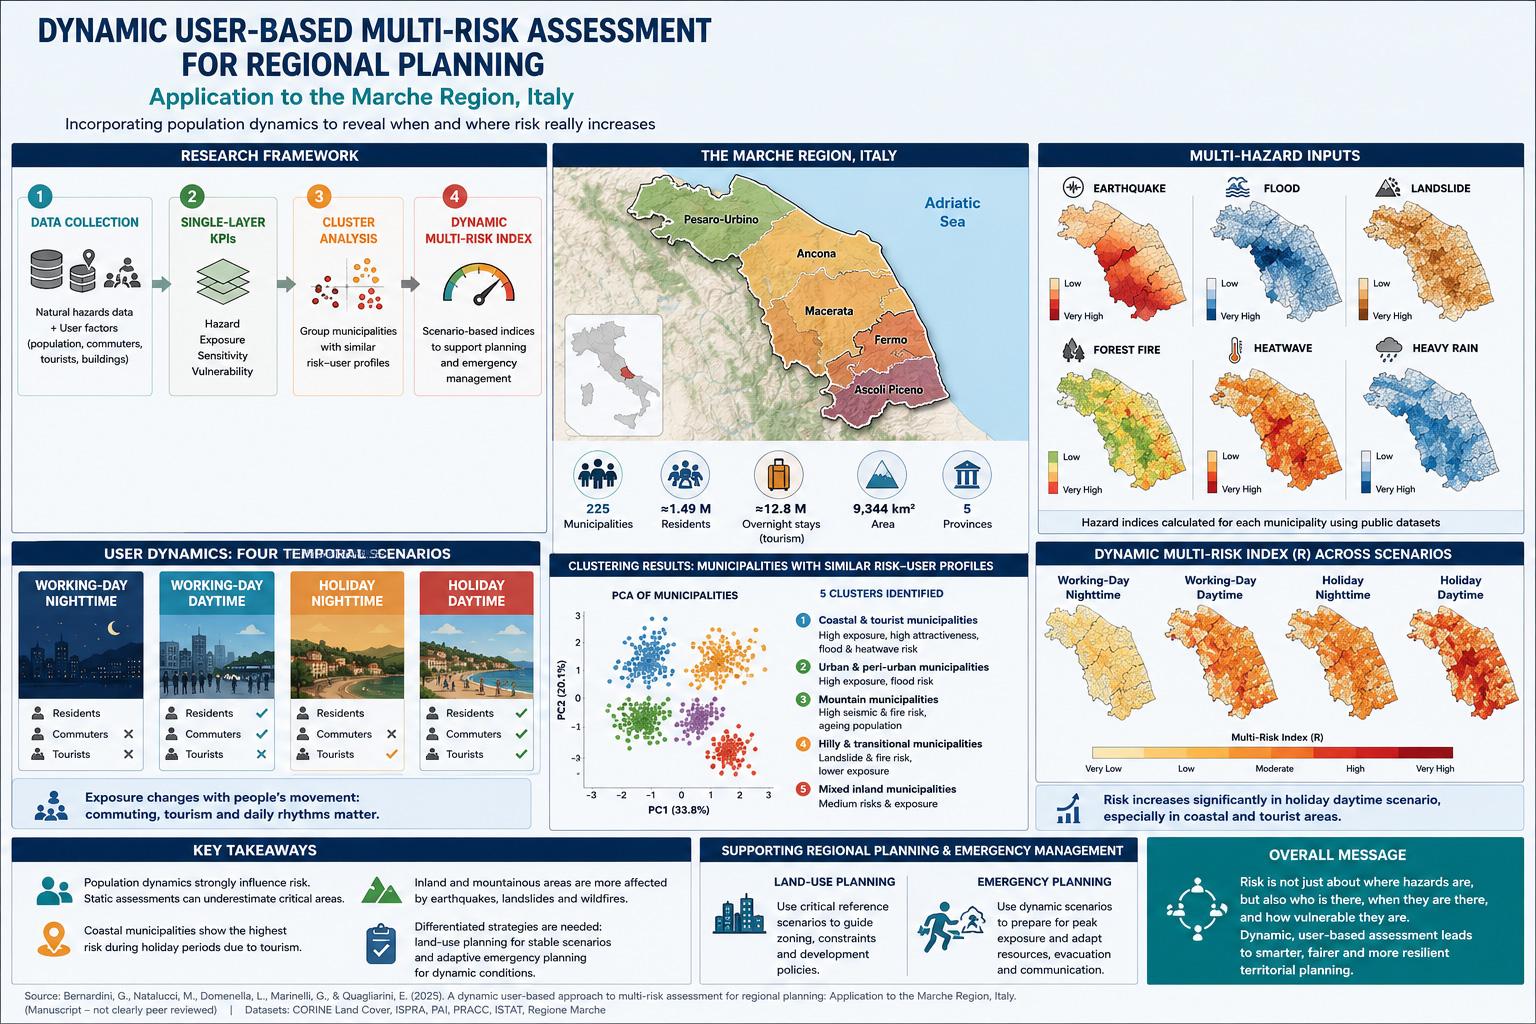
The study addresses a central weakness in many regional risk assessment practices: risk is often evaluated as if territories and populations were static. Traditional planning tools commonly ask where hazards exist and how many residents live there. That is useful, but incomplete. A city, coastal town, mountain village, or tourist municipality does not host the same people at all times. During the day, commuters and students may increase the number of exposed people in urban centres. During holiday periods, tourists may sharply increase exposure in coastal or recreational areas. At night, the population distribution changes again. This study argues that a realistic multi-risk assessment must therefore include not only hazards, but also the changing presence and vulnerability of users.
The problem is important because disaster risk is not created by the hazard alone. A floodplain with no people has a different planning meaning from a floodplain containing residents, commuters, elderly users, tourists, schools, workplaces, hotels, or transport infrastructure. Likewise, a seismic zone becomes more socially critical when the exposed population includes vulnerable groups or users unfamiliar with local emergency procedures. The authors build their framework around this basic risk logic: risk emerges from the combination of hazard, exposure, and vulnerability. Their contribution is to make the exposure and user side more dynamic and more useful for regional planning.
The study fills a gap between two existing research traditions. On one side, single-hazard studies often assess earthquakes, floods, landslides, heatwaves, or wildfires separately. These studies may be detailed, but they are difficult to compare when each hazard uses different scales, datasets, and assumptions. On the other side, multi-risk assessment aims to compare or combine hazards, but it often remains static and does not sufficiently include the changing number and type of people present in a territory. The authors try to bridge this gap by developing a harmonized multi-layer method that keeps hazard-specific information while using a common municipal-scale structure for comparison.
The study area, described in Section 2.1 and illustrated in Figure 2 on page 8, is the Marche Region in Italy. Marche covers approximately 9,344 km² and includes 225 municipalities across five provinces: Ancona, Ascoli Piceno, Fermo, Macerata, and Pesaro-Urbino. The region lies between the Adriatic Sea and the Central Apennines, making it physically diverse and hazard-prone. According to the study, it had about 1,487,000 inhabitants in 2021, more than 2,700,000 yearly tourist arrivals, and about 12,800,000 overnight stays. This matters because the region is not only exposed to natural hazards; it also experiences strong spatial and seasonal population variation.
The historical disaster context reinforces the relevance of the study. The paper mentions the December 1982 Ancona landslide, which caused about 3,660 evacuated persons, destroyed or severely damaged 280 buildings, and affected 342 hectares of urban area. It also refers to the 1987 Fermo-Porto San Giorgio seismic sequence, the 1997 Umbria-Marche earthquake, the 2016–2017 Central Italy seismic sequence with 299 fatalities in the broader affected area, and the September 2022 catastrophic flood, which caused 13 deaths, displaced about 150 people, and affected roughly 4,044 km², about 43% of the regional territory. These examples show that the selected region is not an abstract modelling case. It is a real planning territory where multiple hazards have already produced major human and material consequences.
Figure 1 on page 7 presents the research framework. It is an important diagram because it shows the full workflow in four phases. First, the authors collect data on natural hazards and user factors. Second, they define single-layer Key Performance Indicators, or KPIs, for hazard, exposure, sensitivity, and vulnerability. Third, they use cluster analysis to identify groups of municipalities with similar KPI profiles. Fourth, they calculate dynamic multi-risk indices and use them to guide planning and emergency management policies. The figure does not present results; it clarifies the methodology and shows how inputs and outputs are connected.
Figure 2 on page 8 describes the territorial structure of the Marche Region. It includes the region’s position in Italy, orographic trends, three morphological bands, hydrography, and urbanised areas. This figure is essential because the risks discussed later are strongly connected to geography. The coastal strip is narrow and densely used. The hilly belt dominates the region and contains many river valleys. The Apennine mountain zone is more forested, more seismically exposed, and in some areas more prone to slope instability. The figure helps readers understand why hazards and population exposure do not overlap uniformly across the region.
The datasets used in the study are summarized in Table 1 on page 9. This table is one of the most important technical elements of the paper because it shows that the method is designed to rely on available public datasets. The authors use CORINE Land Cover for forest and vegetation information, seismic zoning data for earthquake hazard, ISPRA and PAI polygons for flood and landslide risk, PRACC regional climate adaptation data for heatwave and heavy-rain criticalities, ISTAT census data for population, commuters, residents, and accommodation capacity, and regional data on urbanised areas. This public-data orientation makes the method more practical for administrations, because it avoids depending on expensive or unavailable proprietary datasets.
Figure 3 on page 10 shows the hazard input maps: CORINE land cover, earthquake classification, ISPRA hydraulic hazardous areas, PAI flood risk areas, IFFI landslide inventory, PAI landslide risk areas, PRACC heatwave forecast indicators, and PRACC heavy-precipitation indicators. The figure shows that each hazard has a different spatial pattern. Forest fire potential is related to vegetated and forested areas, earthquake hazard is stronger in specific Apennine zones, flood risk follows watercourses and coastal lowlands, landslide susceptibility is more spread across hilly and mountain areas, and climate-related hazards such as heatwaves and heavy rain have their own regional patterns. This supports the authors’ argument that single hazards must first be understood separately before being combined into multi-risk indices.
Figure 4 on page 12 maps user-related raw data: resident population, population density, resident population relative to the most populous municipality, work or study commuters, and accommodation capacity. This figure is where the study’s user-based approach becomes visible. Risk is not just about where hazards exist; it is also about where people are concentrated and when they are present. Coastal areas and main urban centres show higher density and attractiveness, while inland areas often have smaller resident populations and different demographic structures. The accommodation-capacity map is especially important because it acts as a proxy for tourist presence in holiday scenarios.
Figure 5 on page 13 provides an overview of the built environment, showing masonry buildings, reinforced concrete buildings, other material types, and construction periods before 1985, between 1985 and 2005, and after 2005. The authors discuss this information but do not include physical building vulnerability directly in the final framework. This is a crucial methodological limitation and decision. They recognize that building characteristics matter for disaster damage, especially earthquakes and floods, but explain that such data are often heterogeneous, locally managed, and not consistently available at regional scale. Therefore, the study focuses on user-related exposure and vulnerability to maintain comparability and replicability across all municipalities.
The methodology defines several single-layer KPIs. For natural hazards, the authors calculate the percentage of each municipality occupied by a given hazard component. This is expressed in Equation 1 as the hazardous area divided by the total municipal area, multiplied by 100. In simple terms, if a larger share of a municipality falls within a mapped hazard zone, that municipality receives a higher hazard component indicator.
Equation 2 combines multiple hazard components into an overall hazard index for a given hazard type. The authors use weights to represent the relative importance or severity of different hazard classes. For example, seismic zone 1 receives a higher weight than seismic zone 4 because it represents stronger earthquake hazard. Similarly, high-risk flood or landslide categories contribute differently from lower-risk categories. The final single-hazard indices are normalized into classes from low to very very high using quantile-based ranges, as shown in Table 2 on page 14.
Table 3 across pages 14–15 is technically central because it lists the formulas for six hazard indices: forest fire, earthquake, flood, landslide, heatwaves, and heavy rain. The forest fire index uses wooded and sparse vegetation components. The earthquake index uses seismic zones with increasing weights from zone 4 to zone 1. The flood index combines PAI and ISPRA flood datasets. The landslide index combines PAI landslide risk and IFFI inventory information. Heatwave and heavy-rain indices use PRACC criticality classes from low to very high. This table shows that the authors do not treat all hazards identically; they harmonize them into a comparable framework while preserving their hazard-specific data sources.
User exposure is defined dynamically. The authors do not only count residents. They consider residents, commuters, and potential tourists. Table 4 on page 16 defines four scenarios: working-period nighttime, working-period daytime, holiday-period nighttime, and holiday-period daytime. Residents are included in every scenario. Commuters are included during daytime scenarios. Tourists are included during holiday scenarios. This scenario structure is one of the study’s main innovations because it allows the same municipality to have different exposure values depending on time and social activity.
Equation 9 calculates exposure density as potential population divided by urbanised area. This is important because the authors do not distribute people uniformly over the whole municipal territory. They distribute users over urbanised areas, where people are more likely to be present. This makes exposure more realistic than simply dividing the population by total municipal area, especially in municipalities with large forests, mountains, agricultural zones, or non-urban land.
Equation 10 normalizes exposure density between 0 and 100. Normalization matters because exposure must later be compared with hazard and vulnerability indicators. Without normalization, indicators measured in different units would not be directly comparable. Equation 11 adds a population ratio at the regional level, comparing each municipality’s resident population with the most populous municipality. This captures not just local density, but regional demographic importance.
The study defines sensitivity as the number of people exposed to a specific hazard at the municipal level. Equation 12 multiplies potential population by the hazard index and divides by 100. This means sensitivity rises when both population presence and hazard intensity are high. The authors apply sensitivity especially to floods and landslides, because these hazards have strong spatial variability at the municipal scale. They do not apply it in the same way to earthquake, heatwave, heavy rain, or wildfire layers, partly because some of these hazard maps affect broader areas or because forested zones generally do not overlap with urbanised areas where users are concentrated.
User vulnerability is treated differently from exposure. In this study, vulnerability is mainly static because detailed demographic information is available for residents but not for commuters or tourists. The authors use age groups as a proxy for vulnerability. Table 5 on page 17 gives weights to five age groups: toddlers aged 0–4 receive a weight of 0.4; parent-assisted children aged 5–14 receive 0.19; young adults aged 15–19 receive 0.08; adults aged 20–69 receive 0.04; and elderly users aged 70+ receive 0.29. These weights reflect the idea that very young children and elderly people may need more assistance during disasters.
Equation 13 calculates overall age-based vulnerability as a weighted sum of age-group percentages. Equation 14 calculates seniority vulnerability by measuring the share of elderly users in the resident population. Equations 15 and 16 introduce tourism-related vulnerability indicators: a familiarity index and an attractiveness index. The familiarity index compares sleeping places with residents and is intended to capture the relative presence of non-familiar users. The attractiveness index compares the number of sleeping places in a municipality with the maximum number of sleeping places among all municipalities. These indicators matter because tourists may not know local hazards, evacuation routes, emergency procedures, or safe places.
The authors then use cluster analysis to group municipalities with similar risk-user profiles. Section 2.3 explains that they use agglomerative hierarchical clustering with Ward’s linkage. This method groups municipalities by similarity across 13 predictors, including six natural hazard indices, exposure indicators, and vulnerability indicators. Table 6 on page 19 lists these predictors. The use of clustering is not only a statistical exercise. For regional planning, it helps identify groups of municipalities that may need similar planning strategies or emergency-preparedness priorities.
Section 2.4 defines the dynamic multi-risk index. First, Equation 17 combines the six single-hazard indices into a normalized hazard indicator H. The authors do not assign different weights to different hazards in this combined H index because they avoid claiming that one hazard is inherently more important than another in all contexts. Then they combine H with exposure and vulnerability.
Equation 18 is the central multi-risk formula. It defines the multi-risk index R as a Euclidean distance in a normalized plane where one dimension is hazard and the other is the product of exposure and vulnerability. In simplified terms, the index measures how far a municipality is from an ideal condition of very low hazard and very low exposed-vulnerable population. The formula is:
R = square root of [(E/100 × V/100)² + (H/100)²] × 100
This formulation matters because it avoids arbitrary weighting between hazard and user-related risk. It also makes high combined values more visible because the terms are squared before being added. The authors also define a differential risk index, ΔR, which measures how much risk changes between contrasting temporal scenarios, especially between holiday daytime and working-day nighttime conditions. ΔR is one of the most useful planning outputs because it shows where risk is volatile due to changing user presence.
The results begin with single-hazard patterns. Figure 6 on page 23 maps the six hazard indices. Forest fire risk is higher in inland and mountain areas with more forest or sparse vegetation, although the absolute values remain moderate. Earthquake risk is highest in the southern part of the region, especially along the central-southern Apennines. Flood risk is concentrated along coastal plains and major river valleys, where flood-prone areas overlap with urbanisation. Landslide risk is widely distributed across hilly interiors because of steep slopes, clay-rich soils, and geomorphological instability. Heatwave risk is stronger in central and northern municipalities, often linked to urbanised and densely populated areas. Heavy-rain risk is elevated in northern and mountainous sectors where orographic effects intensify precipitation.
Figure 7 on page 24 shows exposure under four scenarios. Working-day nighttime exposure reflects mainly residents and acts as a baseline. Working-day daytime exposure increases in larger urban centres because commuters and students enter these municipalities. Holiday nighttime exposure rises in tourist-oriented areas because accommodation capacity is included. Holiday daytime exposure is the highest scenario because it combines residents, commuters, and tourists. This figure visually demonstrates the main argument of the study: exposure is not fixed.
Figure 8 on page 25 maps the maximum difference in exposure between holiday daytime and working-day nighttime. It shows that exposure increases are especially relevant in coastal municipalities, but not only there. The study notes a more spatially uniform increase across the region than one might expect. This means that planners should not assume that only large coastal cities experience dynamic exposure changes. Smaller municipalities may also shift risk profiles when seasonal or daily users are included.
Figure 9 on page 26 maps flood sensitivity across the four scenarios. Flood sensitivity is highest in coastal municipalities and river-valley areas where flood hazard overlaps with dense population presence. This result is important for emergency planning because floods are highly spatial. A municipality does not become sensitive simply because it has many people; it becomes more sensitive when people are present in areas where flood hazard is also significant.
Figure 10 on page 27 maps landslide sensitivity. Unlike flood sensitivity, landslide sensitivity is more spread across hilly and mountainous municipalities. This reflects the geography of Marche, where slope instability is widespread in inland areas. The figure shows that landslide-related planning cannot be limited to a few hotspots; it often requires broader attention across central and inner territories, especially where settlements or infrastructure overlap with landslide-prone land.
Figure 11 on page 28 maps the vulnerability index. The authors find that vulnerability values are relatively homogeneous across the region, mostly ranging between 30 and 60. This is because the age structure of municipalities is broadly similar, and because adults aged 20–69 form the largest population group and receive the lowest vulnerability weight. The map still matters because it provides a baseline layer of social fragility. However, it also reveals a limitation: vulnerability is less dynamic than exposure in this study, because demographic data for tourists and commuters are not disaggregated.
Figure 12 on page 29 shows the cluster analysis. The scatterplot based on the first two principal components separates municipalities into five clusters, while the map shows their spatial distribution. This figure supports the claim that municipalities can be grouped into meaningful territorial risk profiles. The clusters are not random; they correspond to coastal, hilly, mountain, transitional, and tourism-related patterns.
Figure 13 on page 30 shows median predictor values for each cluster. Cluster 1 mainly includes hilly municipalities with medium-to-high population density and significant landslide risk. Cluster 2 includes municipalities between hilly and coastal zones with relatively high flood risk and elevated exposure. Cluster 3 includes mountain municipalities with very high seismic hazard, high forest fire risk, low exposure, and a higher proportion of elderly residents. Cluster 4 includes other mountainous and transitional municipalities with elevated forest fire and landslide hazards and notable unfamiliarity vulnerability. Cluster 5 includes coastal municipalities with the highest exposure, population relevance, unfamiliarity, and territorial attractiveness; the authors identify it as the most critical cluster in terms of combined hazard, exposure, and vulnerability.
Figure 14 on page 31 maps the combined hazard index H. It shows moderate to high hazard values in much of the region, especially central and southern inland areas where multiple hazards overlap. Coastal areas often show lower combined hazard values than inland mountain or hilly areas, but this does not mean coastal areas are low-risk overall. Their final risk can still be high because exposure and user dynamics are much stronger there.
Figure 15 on page 32 presents a three-dimensional Cartesian representation of exposure, hazard, and vulnerability under the four temporal scenarios. In the working-day nighttime scenario, most municipalities cluster toward low hazard and low exposure. In the working-day daytime scenario, municipalities spread toward higher exposure because commuting increases user presence. In the holiday nighttime scenario, the distribution shifts modestly because tourist overnight stays are included. In the holiday daytime scenario, the spread is greatest, showing the complexity of peak seasonal risk. This figure is useful because it shows that the same territory can move within the risk space when users move.
Figure 16 on page 33 maps ExV, the product of exposure and vulnerability, across the four scenarios. Because vulnerability is relatively homogeneous, ExV variation is mainly driven by exposure. Holiday daytime produces the highest ExV values, especially along the Adriatic coast and in central urban areas. This reinforces the importance of tourism, commuting, and daytime mobility in risk assessment. A municipality with moderate hazard can become more critical when its exposed vulnerable population rises.
Figure 17 on page 34 plots hazard against ExV for the four scenarios and includes regression lines for maximum and minimum values. The authors note that the R² values are low, meaning that simple linear relationships do not fully explain multi-layer risk data. This is expected because risk is multidimensional and spatially heterogeneous. Still, the plots help identify municipalities that fall outside general trends and may require more detailed assessment. In planning terms, such outliers can become candidates for targeted mitigation, emergency planning, or land-use policy review.
Figure 18 on page 36 maps the final multi-risk index R across the four scenarios. The study reports that R values range approximately from 0.3 to 47.3. Working-day nighttime produces mostly low to moderate risk. Working-day daytime intensifies risk in several municipalities, especially urban and industrial areas along floodplains and coastal zones. Holiday nighttime shows localized peaks in coastal and tourist areas. Holiday daytime produces the most widespread and elevated risk configuration, especially in tourist destinations. This is one of the study’s strongest results because it directly shows that multi-risk increases when dynamic users are included.
Figure 19 on page 37 presents the differential risk index ΔR. The frequency distribution shows that most municipalities have limited ΔR values, with a modal peak around 4–5%. However, some municipalities, especially coastal ones, reach values up to 37%. This means their risk changes sharply depending on the scenario. The spatial map confirms that higher ΔR values cluster mainly along coastal areas, while inland areas often show more stable risk profiles. This is highly useful for policy because high ΔR municipalities may not always be high-risk, but they can become critical during specific periods. That calls for adaptive emergency planning rather than only permanent land-use restrictions.
The discussion identifies several key findings. First, coastal municipalities, especially tourism-driven ones, show the highest multi-risk conditions because user exposure and vulnerability are high. Second, inner areas are shaped more by multi-hazard combinations, especially earthquakes and landslides in hilly and mountain zones, and floods in valley municipalities. Third, the biggest changes in risk come less from day-night differences and more from working versus holiday periods. Fourth, clustering, R, and ΔR produce a coherent interpretation aligned with the geographic and socio-economic structure of the Marche Region. Fifth, regional planning should move toward differentiated strategies that reflect both stable hazard conditions and temporal population dynamics.
The practical value of the study lies in its planning orientation. It does not only produce maps for academic comparison. It offers a framework that can support land-use policy, regional coordination, municipal emergency planning, and Civil Protection activities. For example, a municipality with permanently high hazard but low exposure may need different policies from a coastal municipality with moderate hazard but extreme seasonal exposure. Similarly, a place with high ΔR may need flexible emergency staffing, temporary signage, multilingual risk communication, seasonal evacuation planning, or tourism-specific preparedness rather than only static zoning rules.
The study also explains why static planning still has a role. Legal planning systems often require stable reference scenarios because land-use regulations cannot change every hour. However, the authors argue that even static plans should be informed by dynamic analysis. Authorities can use dynamic scenarios to choose conservative reference conditions, such as holiday daytime or peak tourist exposure, when designing emergency plans and land-use restrictions. In this way, dynamic assessment does not replace statutory planning; it makes it more realistic.
Another policy implication is the need for permanent observatories. Population dynamics, tourism flows, housing supply, transport networks, and mobility patterns change over time. If risk maps are built once and not updated, they may quickly become inaccurate. The study suggests that regional and municipal authorities should periodically update user-related data and integrate those updates into planning and emergency management.
The paper’s limitations are clearly important. First, some data are outdated. The commuter data and some built-environment data rely on older census sources, including 2011 datasets. This can affect exposure estimates in municipalities that have changed significantly. Second, physical building vulnerability is not fully integrated, even though building age, structural type, and maintenance condition strongly affect earthquake and flood consequences. Third, tourist vulnerability is simplified because tourist age, origin, group composition, language, and mobility limitations are not available. Fourth, the study does not estimate actual losses such as deaths, injuries, economic damages, infrastructure disruption, or service interruption. It provides comparative risk indices rather than consequence models.
These limitations do not invalidate the framework, but they define how it should be used. The study is strongest as a regional planning-support tool. It is not a precise prediction of casualties or economic loss. It helps authorities identify where risk is structurally high, where risk changes by scenario, and where more detailed local studies may be needed. Future research could improve the method by adding mobile phone data, smart-card mobility data, updated accommodation statistics, cadastral records, remote sensing, high-resolution hazard maps, building vulnerability datasets, and stakeholder validation with municipal and Civil Protection officials.
The broader significance of this study is that it makes risk more human and more temporal. A map of hazards is not enough. A map of residents is not enough. A planning authority needs to know who is present, when they are present, how vulnerable they may be, whether they know the territory, and how hazards overlap with those patterns. By combining hazard layers with dynamic user scenarios, the study moves regional risk assessment closer to the real conditions under which disasters occur.
For today’s climate and disaster-risk context, this is highly relevant. Climate change is increasing the urgency of flood, heatwave, wildfire, and extreme-rain planning. At the same time, tourism, commuting, ageing populations, and regional mobility are changing exposure patterns. A municipality’s risk is no longer adequately described by its resident population alone. The Marche Region case shows that risk-sensitive planning must be both spatial and temporal.
For the future, the study points toward more adaptive regional governance. Land-use planning can use stable scenarios to guide long-term development, zoning, and infrastructure choices. Emergency planning can use dynamic scenarios to prepare for peak exposure, seasonal risk, evacuation needs, and temporary user concentrations. The most valuable outcome is not a single final risk score, but a way of thinking: risk is a moving relationship between hazards, territory, and people.
Source and Method Note
The source analyzed here is A dynamic user-based approach to multi-risk assessment for regional planning: Application to the Marche Region, Italy by Gabriele Bernardini, Maud Natalucci, Luca Domenella, Giovanni Marinelli, and Enrico Quagliarini. The authors are affiliated with Università Politecnica delle Marche, including the DICEA and SIMAU departments. The work acknowledges funding by the Marche Region under Framework Agreement Reg. Int. 4239 of 15/10/2024.
The PDF does not clearly show a journal name, DOI for the article itself, conference acceptance, publication volume, issue number, or formal peer-review statement. Therefore, this article should be treated as a technical/research manuscript or working-paper style academic manuscript, and its peer-review status is not clearly peer reviewed. The results should be interpreted carefully as a methodological and planning-support contribution rather than as a fully settled or formally validated policy standard.
The study uses a multi-layer municipal-scale methodology applied to the Marche Region in Italy. It analyzes 225 municipalities across five provinces and uses public datasets from sources such as CORINE Land Cover, Regione Marche, ISPRA, PAI, PRACC, ISTAT census data, and regional urbanised-area datasets. QGIS is used to organize spatial inputs, while MATLAB R2024b is used for clustering and visualization tasks including PCA scatterplots, hierarchical dendrograms, and boxplots.
The hazards considered are forest fire, earthquake, flood, landslide, heatwaves, and heavy rain. The method calculates single-hazard indices using area-based indicators and weighted combinations of hazard classes. User exposure is calculated dynamically using four scenarios: working-period nighttime, working-period daytime, holiday-period nighttime, and holiday-period daytime. Residents are included in all scenarios, commuters in daytime scenarios, and tourists in holiday scenarios. Exposure density is calculated over urbanised areas rather than entire municipal territories.
User vulnerability is mainly age-based and calculated using weighted age classes: toddlers, parent-assisted children, young adults, adults, and elderly users. Additional vulnerability indicators account for seniority, unfamiliarity, and territorial attractiveness related to tourism. Sensitivity is calculated for floods and landslides by combining potential population and hazard indices. The final multi-risk index R is computed as a normalized Euclidean distance combining hazard and the product of exposure and vulnerability. A differential index ΔR measures the maximum change in risk between contrasting temporal scenarios.
The paper contains several important visuals and tables. Figure 1 on page 7 shows the four-phase research framework. Figure 2 on page 8 describes the Marche Region’s territorial, morphological, hydrographic, and urbanised structure. Table 1 on page 9 summarizes the public datasets used. Figure 3 on page 10 maps hazard input layers. Figure 4 on page 12 maps population, commuter, and accommodation-capacity data. Figure 5 on page 13 provides a built-environment overview. Table 3 on pages 14–15 lists hazard indices and formulas. Table 4 on page 16 defines the four user-presence scenarios. Table 5 on page 17 gives age-group vulnerability weights. Table 6 on page 19 lists predictors used for clustering. Figures 6–19 on pages 23–37 present hazard, exposure, sensitivity, vulnerability, clustering, multi-risk, and differential-risk results.
This article is not an official emergency plan, legal land-use order, engineering certification, safety approval, investment advice, health advice, clinical recommendation, diagnosis, or public policy directive. It explains a research methodology and its case-study application. Because the peer-review status is not clearly established in the PDF, the findings should be used as planning-oriented academic evidence requiring further validation, stakeholder review, and local adaptation before operational adoption.