This study deals with one of the most difficult problems in urban remote sensing: how to recover building heights for a past date when no direct height data exist. Cities are usually studied from above as two-dimensional surfaces, but modern urbanization is three-dimensional. A city may expand horizontally through new land development, but it may also grow vertically through taller residential towers, office buildings, commercial complexes, and dense redevelopment. To understand this vertical urbanization, researchers need building height data from multiple time periods.
The difficulty is that historical building height data are rare. Modern LiDAR surveys can provide accurate three-dimensional measurements, but they are expensive and have become widely available only in recent years. Older high-resolution satellite images often exist, but they are usually single-view optical images, not direct height measurements. The central question of the paper is therefore practical and important: can we estimate historical building heights from archived high-resolution satellite imagery by using more recent local height data as a reference?
The authors begin from the idea that building height is a key metric of 3D urban structure. Height data support urban planning, land-use efficiency analysis, 3D building reconstruction, disaster assessment, environmental impact assessment, urban heat studies, and detection of building change. A city’s skyline also reflects socioeconomic activity. Tall buildings may indicate commercial concentration, redevelopment pressure, land scarcity, or administrative planning priorities. Therefore, estimating building heights across time is not a narrow technical exercise; it helps reconstruct the physical history of urban growth.
The study focuses on two technical problems that limit existing deep learning approaches. The first is the viewing angle mismatch between satellite images and height data. High-resolution satellite images are often off-nadir, meaning the sensor looks at the ground from a tilted angle rather than directly from above. In dense urban areas, this causes tall buildings to appear displaced or tilted. Roofs and facades are visible in the image, while the reference height data, such as DSM or nDSM, usually represent a true orthographic view from directly above. If a model learns from mismatched image and height pixels, its training labels are geometrically inconsistent.
The second problem is cross-temporal transfer. A deep learning model trained with one year’s image and height data may perform poorly when applied to another year’s image. Even if the buildings are unchanged, images from different dates may have different viewing angles, illumination, shadows, sensor characteristics, seasonal conditions, and spectral responses. These differences can reduce accuracy when the model tries to estimate historical heights. If buildings changed between the two dates, the problem becomes even harder because the later reference height no longer represents the earlier target condition.
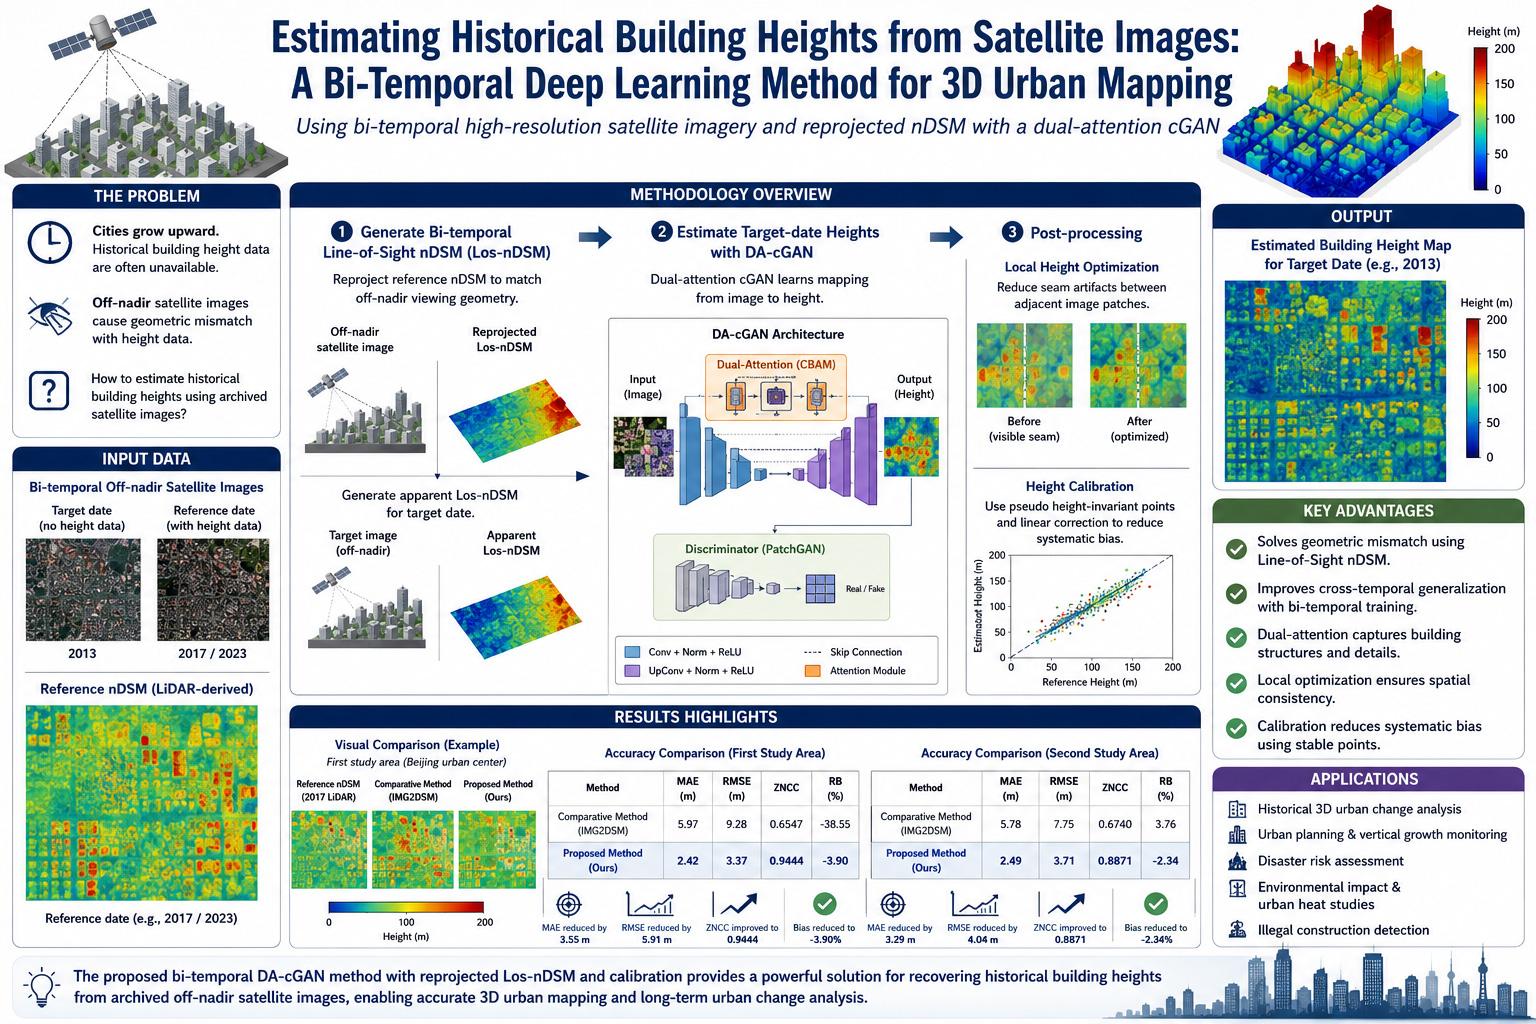
The paper proposes a method that uses bi-temporal high spatial resolution satellite images and local reference height data. In the authors’ terminology, the reference-temporal image is the image from the date where local height data are available, while the target-temporal image is the image from the date where height data are missing. In many practical cases, the reference date is more recent and the target date is historical.
The method has three main stages. First, the authors generate bi-temporal line-of-sight nDSMs, abbreviated as Los-nDSMs. Second, they estimate target-temporal building heights using a dual-attention conditional Generative Adversarial Network, called DA-cGAN. Third, they perform local height optimization and global height calibration to improve the final height map.
Figure 1 on page 5 shows the geographical locations of the two study areas in Beijing. The first study area is in the main urban center of Beijing. It covers about 24 km², approximately 3 km east-west and 8 km north-south. The southwest part contains many low-rise traditional buildings, especially bungalows in Dongcheng, while the northern sector includes more mid- and high-rise buildings. This makes it a useful area for testing whether the method can handle different building heights in a dense urban core.
The second study area is Tongzhou New City, also known as the Beijing Municipal Administrative Center. It covers about 146 km², approximately 9.6 km east-west and 15.2 km north-south. This area has undergone major urban change over the last decade, including demolition of old residential areas, factories, and rural areas, followed by construction of new residential zones, parks, roads, and high-rise buildings along the Tongzhou Grand Canal. This makes it especially relevant for historical height estimation because many buildings changed between the image dates.
Table 1 on page 6 gives the parameters of the bi-temporal satellite images. In the first study area, WorldView-2 images from 2013 and 2017 are used. The 2017 image is the reference-temporal image because LiDAR-derived height data exist for 2017, while the 2013 image is the target-temporal image for historical height estimation. In the second study area, Pleiades images from 2013 and 2023 are used. The 2023 image is the reference-temporal image, while the 2013 image is the target-temporal image. The table also reports sun azimuth, sun elevation, satellite azimuth, satellite elevation, and off-nadir angle. The off-nadir angles range from about 10.1° to 17.1° in the bi-temporal image sets, confirming that tilted viewing geometry is a real issue in the experiments.
The image preprocessing is important. The authors fuse multispectral bands with panchromatic bands using Gram-Schmidt pan-sharpening, producing multispectral images at 0.5 m resolution. They then co-register the target-date images to the reference-date images, with registration RMSE below 0.5 pixels. This level of geometric registration is essential because building height estimation at 0.5 m resolution is very sensitive to misalignment. A small spatial mismatch can cause roof pixels, facade pixels, road pixels, and shadow pixels to be incorrectly associated with height values.
For reference height data, the study uses airborne LiDAR point clouds from local areas. In the first study area, 2017 LiDAR point cloud data are used with a point density of 30 points per square meter. In the second study area, 2023 LiDAR point cloud data are also used with a point density of 30 points per square meter. The authors generate nDSM data by denoising the point cloud, creating a DSM from first-echo points, generating a DEM using a Cloth Simulation Filter and hydrological analysis, and subtracting DEM from DSM. In simple terms, nDSM represents object height above the ground, including building height.
Figure 2 on pages 8–9 shows the data used in the first study area: the 2013 WorldView-2 image, the 2017 mosaicked WorldView-2 image, the 2017 LiDAR-derived nDSM, and the 2013 pair-derived nDSM used for evaluation. The red rectangle marks the training area, while the blue rectangle marks the evaluation area. This figure is important because it shows the separation between local training height data and broader evaluation. The method does not assume that full historical LiDAR data exist; instead, it tries to estimate historical heights using satellite imagery and limited reference height information.
Figure 3 on pages 10–11 shows the data used in the second study area: the 2013 Pleiades image, a subset of that image, the 2023 Pleiades image, the 2023 LiDAR-derived local nDSM, and the 2023 BJ-3 derived global nDSM. The red rectangle indicates the training area, while the yellow rectangle outside it indicates the evaluation area. This is a stronger test of spatial generalization because the method must estimate building heights beyond the local LiDAR coverage.
Figure 4 on page 11 shows the generalized stereo image pair and generated 2013 nDSM used for evaluation in the second study area. Since historical LiDAR data are not available, the authors generate evaluation nDSM from satellite stereo pairs. This is not the same as having perfect ground truth, and the authors acknowledge later that reference data quality may affect evaluation, especially in changed building areas. Still, it provides a way to test whether the proposed method approximates historical height conditions better than a comparative method.
The first methodological innovation is the line-of-sight nDSM. A normal nDSM is aligned with a true-ortho view, but the satellite image is off-nadir. A tall building’s roof and facade in the satellite image may appear shifted relative to the nDSM. To fix this, the authors reproject the nDSM into the viewing direction of the satellite sensor. The result is a line-of-sight nDSM that matches the image-plane geometry of the off-nadir image.
This matters because a deep learning model learns pixel-to-pixel relationships. If the image pixel shows a tilted building facade but the label pixel comes from a vertical top-down height model, the model receives confusing supervision. The Los-nDSM reduces this mismatch by making the height map look from the same direction as the satellite image. Instead of forcing the image into a true-ortho geometry, the method projects the height data into the image geometry. This preserves consistency between training images and prediction images.
Figure 5 on page 12 presents the full flowchart of the proposed method. It begins with the reference-temporal HSR satellite image, the reference-temporal nDSM, and the target-temporal HSR satellite image. From these, the method generates reference-temporal Los-nDSM and target-temporal apparent Los-nDSM. Then it trains the DA-cGAN using bi-temporal images and Los-nDSMs in local areas. After height prediction, local height optimization is applied, followed by height calibration based on pseudo height-invariant points. The flowchart clearly shows that the method is not a single neural network alone; it is a complete pipeline combining geometric reprojection, deep learning, local post-processing, and calibration.
The Los-nDSM generation method improves previous line-of-sight reprojection approaches by reprojecting multiple height levels, not only rooftop pixels. The authors set the vertical interval between building height levels to 3 m. The highest reprojected height is selected for each pixel based on perspective projection and line-of-sight occlusion. Missing pixels are then filled by spatial interpolation. This is designed to reduce gaps along building facades, especially for high-rise buildings, where off-nadir imagery reveals vertical surfaces that ordinary rooftop-only reprojection may not label properly.
The second methodological innovation is the DA-cGAN model. A cGAN, or conditional Generative Adversarial Network, learns an image-to-image mapping: in this case, from off-nadir satellite image patches to height maps. The generator produces estimated heights, while the discriminator tries to distinguish real height maps from generated ones. Through adversarial training, the generator learns to produce height maps that are not only numerically close to reference heights but also structurally plausible.
The generator uses a U-Net architecture, which is common for pixel-level prediction tasks because it combines encoder-decoder processing with skip connections. The paper enhances these skip connections with a dual-attention module based on CBAM, the Convolutional Block Attention Module. CBAM operates across channel and spatial dimensions. In practical terms, channel attention helps the network decide which feature channels are important, while spatial attention helps it focus on important image regions such as building edges, roofs, facades, and shadows.
The term “dual-attention” in this paper refers to applying attention to both encoder-derived and decoder-derived features before concatenation in the skip connections. This matters because building height estimation from off-nadir images requires both fine local details and broader semantic understanding. Roof edges, facade textures, and shadow patterns may provide local height clues, while the overall building form helps interpret those clues correctly. The dual-attention module helps the model focus on useful building-related information and suppress irrelevant background features.
The discriminator follows a PatchGAN architecture. Instead of judging the entire image as real or fake at once, PatchGAN evaluates local patches. In high-resolution remote sensing, this is useful because buildings have fine local structures. Patch-wise discrimination encourages the generated height map to preserve local building outlines and structural details. The discriminator outputs a 30×30×1 matrix of local confidence probabilities, where each value indicates whether a local patch looks real.
The loss functions are described in Equations 1 and 2 on page 15. Equation 1 defines the discriminator loss. It trains the discriminator to classify real image-height pairs as real and generated image-height pairs as fake. Equation 2 defines the generator loss. It combines adversarial loss with L1 reconstruction loss. The adversarial loss pushes the generator to produce realistic height structures, while the L1 loss keeps the generated heights numerically close to the reference heights. The weighting coefficient λ is set to 10, meaning the reconstruction term is given substantial importance. This is appropriate because height estimation is not only a visual translation task; the actual meter-level height values matter.
The local height optimization step addresses a practical problem caused by patch-based prediction. The model predicts height maps from 256×256 image patches. If a building lies across two adjacent patches, the predicted height may become inconsistent along the seam. To reduce this artifact, the authors perform a second prediction after shifting the patch grid by 128 pixels right and 128 pixels downward. Then they compare seam differences. If the average height difference across a seam is below 3 m, the seam is accepted. If not, heights within a 20-pixel buffer, equivalent to 10 m at 0.5 m resolution, are fused using a weighted average. This helps preserve building continuity across patch boundaries.
The height calibration step addresses global systematic error. Cross-temporal height estimation may systematically underestimate or overestimate heights. The authors select pseudo height-invariant points from bi-temporal images. These are pixels likely to have remained stable between the two dates. They use a multiband temporal texture measure called PCMV, or Pseudo Cross Multivariate Variogram, to detect change intensity. They also exclude vegetation pixels using NDVI and blue band values because vegetation height may change due to growth or pruning.
The calibration model is given in Equation 3 on page 16. It is a linear correction: calibrated height equals k times estimated height plus C. Equation 4 estimates k and C using weighted least squares. Points with lower PCMV values, meaning higher likelihood of temporal stability, receive greater weight. This is a careful design choice because not all pseudo-invariant points are equally reliable. The model gives more influence to pixels that appear more stable.
The evaluation metrics are defined in Equations 5–8 on pages 16–17. MAE measures average absolute height error in meters. RMSE penalizes larger errors more strongly. ZNCC measures correlation between estimated and reference heights. RB, or relative bias, measures systematic overestimation or underestimation. A positive RB indicates overestimation; a negative RB indicates underestimation. A value closer to zero indicates less systematic bias. These metrics together are appropriate because a method can have good correlation but still be biased, or it can have low average error but poor performance on tall buildings.
Figure 7 on page 18 demonstrates why Los-nDSM is needed. It compares off-nadir images, ordinary nDSM, and generated Los-nDSM portions. The true-ortho nDSM does not align perfectly with the tilted buildings in the satellite image. In contrast, the Los-nDSM aligns with the image geometry, including building rooftops and facades. The red boxes highlight building rooftops. This figure visually supports one of the paper’s most important claims: geometric consistency between satellite image and height label is essential for learning accurate height features.
The experimental setup uses 793 training patches in the first study area. Training is conducted for 200 epochs with a batch size of 1, using the Adam optimizer and an initial learning rate of 1e-5. The learning rate decays after the 100th epoch. The experiments are implemented in PyTorch 2.7.1 using a single NVIDIA GeForce RTX 3060 GPU with CUDA 11.8. For a 256×256×3 input image, the DA-cGAN model uses 0.36 GB peak GPU memory, 55.99 GFLOPs, and about 16.88 ms inference time. These details matter because they show the method is computationally feasible on accessible GPU hardware, not only on large supercomputing systems.
Figure 8 on page 19 shows the PCMV texture map used for selecting pseudo height-invariant points. The red boxes indicate high PCMV values, corresponding to changed roofs or changes caused by tilt angle differences. The yellow boxes indicate low PCMV values, corresponding to stable areas that can be used for calibration. The authors select 2,600 height-invariant points and 5,200 height-variant points for threshold determination using Monte-Carlo Cross Validation. The optimal PCMV threshold is 3000. After excluding vegetation pixels, the calibration coefficients are calculated as k = 1.0649 and C = 0.5635 m. This means the calibration slightly scales up estimated heights and adds a small positive offset, helping reduce underestimation.
The first study area results include an ablation study. Figure 9 on page 21 compares six experimental settings: the baseline method, a version without Los-nDSM, a version using only reference-temporal information, a version replacing DA-cGAN with IMG2DSM, a version without local height optimization, and the full proposed method with calibration. The visual examples show that omitting Los-nDSM causes building outlines to misalign with image tilt. Using only reference-temporal information causes high-rise buildings to be underestimated. Replacing DA-cGAN with IMG2DSM produces incomplete high-rise heights. Removing local height optimization creates seam-related inconsistency. The full proposed method gives the most visually coherent result.
Table 3 on page 22 quantifies the ablation results for the first study area. The baseline method achieves MAE = 2.78 m, RMSE = 3.81 m, ZNCC = 0.9444, and RB = -13.62%. Replacing Los-nDSM with ordinary nDSM worsens RMSE to 5.47 m and ZNCC to 0.8650. Using only reference-temporal information performs worst, with MAE = 4.57 m, RMSE = 7.21 m, ZNCC = 0.8158, and RB = -28.07%. Replacing DA-cGAN with IMG2DSM gives MAE = 3.79 m and RMSE = 5.47 m. Removing local height optimization gives MAE = 2.92 m and RMSE = 4.11 m. The full proposed method improves to MAE = 2.42 m, RMSE = 3.37 m, ZNCC = 0.9444, and RB = -3.90%.
These numbers show that each key step has a measurable role. Los-nDSM improves geometric consistency. Bi-temporal training prevents poor cross-temporal generalization. DA-cGAN improves height structure compared with the older IMG2DSM model. Local optimization reduces patch seam artifacts. Calibration reduces systematic underestimation. The strongest bias improvement comes from calibration, which moves RB from -13.62% in the baseline to -3.90% in the full method.
Figure 10 on page 23 shows scatterplots for the six first-area experiments. The results without Los-nDSM, without bi-temporal information, or without DA-cGAN show many points below the 1:1 line, indicating underestimation. The proposed method distributes points more evenly around the 1:1 line, showing reduced bias. This figure is useful because it reveals not only average error but also the pattern of error across height ranges. Height estimation methods often fail most visibly for taller buildings, and the scatterplots make that problem easier to see.
The comparison with a single-temporal method is shown in Figure 11 on page 24 and Table 4 on page 25. The comparative method, IMG2DSM, uses a reference-temporal image and local nDSM. When applied to 2013 in the first study area, it achieves MAE = 5.97 m, RMSE = 9.28 m, ZNCC = 0.6547, and RB = -38.55%. The proposed method achieves MAE = 2.42 m, RMSE = 3.37 m, ZNCC = 0.9444, and RB = -3.90%. Therefore, the proposed method reduces MAE by 3.55 m and RMSE by 5.91 m, while increasing correlation and dramatically reducing underestimation.
Table 4 also separates unchanged and changed buildings. For unchanged buildings, the comparative method has MAE = 6.14 m and RMSE = 9.49 m, while the proposed method has MAE = 2.42 m and RMSE = 3.37 m. For changed buildings, the comparative method has MAE = 3.14 m and RMSE = 4.32 m, while the proposed method has MAE = 2.42 m and RMSE = 3.46 m. The fact that the proposed method performs well on both changed and unchanged buildings suggests it can handle stable structures affected by viewing/spectral differences and changed structures where the target-date height must be reconstructed.
The second study area provides a larger and more challenging test. Figure 12 on page 26 shows unchanged building areas in Tongzhou. The proposed method produces more complete building outlines and better alignment with tilted high-rise buildings than the comparative method. It also performs better for low-rise buildings. This is important because a useful urban height estimation method must not only work on towers; it must also preserve low-rise neighborhoods, mixed-use blocks, and smaller structures.
Figure 13 on page 27 shows changed building areas between 2013 and 2023. The proposed method better recovers the historical 2013 height state than the comparative method. The red boxes indicate changed areas. This is one of the most meaningful visual demonstrations in the paper because historical height estimation is most valuable precisely where the urban fabric changed. If the method only worked on unchanged buildings, its value for urban change analysis would be limited.
Table 5 on page 28 gives the second-area quantitative results. For unchanged buildings, the comparative method has MAE = 5.78 m, RMSE = 7.75 m, ZNCC = 0.6740, and RB = 3.76%. The proposed method improves these values to MAE = 2.49 m, RMSE = 3.71 m, ZNCC = 0.8871, and RB = -2.34%. This means MAE is reduced by 3.29 m and RMSE by 4.04 m, while correlation increases substantially.
The second-area results also distinguish low-rise and high-rise buildings. For low-rise unchanged buildings, the proposed method reduces MAE from 5.41 m to 2.22 m and RMSE from 7.20 m to 3.23 m. For high-rise unchanged buildings, it reduces MAE from 10.55 m to 5.99 m and RMSE from 12.92 m to 7.56 m. The improvement is larger for high-rise buildings, which makes sense because high-rise buildings suffer more from off-nadir tilt. This supports the authors’ claim that Los-nDSM is especially useful for taller buildings.
For changed buildings in the second study area, the comparative method has MAE = 5.10 m and RMSE = 6.71 m, while the proposed method improves to MAE = 3.63 m and RMSE = 4.45 m. The RB remains relatively high for both methods, -24.32% for the comparative method and -22.77% for the proposed method. The authors suggest this may be partly due to lower precision in the 2013 pair-derived reference nDSM compared with the 2023 BJ-3 derived data. This is a necessary caution: evaluation quality depends on reference data quality.
Figure 14 on page 29 shows the final 2013 height estimation result for the second study area using the proposed method. The map covers a much larger spatial extent than the local LiDAR training area. The authors state that most building boundaries are well delineated and estimated heights are accurate. This figure demonstrates the method’s intended application: using limited reference height data and archived high-resolution imagery to produce broader historical height maps.
The discussion also analyzes model generalization. Table 6 on page 30 compares local-specific models trained on one region with a multi-site joint model trained on samples from both study areas. In the first study area, the local-specific WorldView-2 model performs better, with MAE = 2.78 m, RMSE = 3.81 m, and ZNCC = 0.9444, compared with the multi-site joint model’s MAE = 3.06 m, RMSE = 4.58 m, and ZNCC = 0.9270. In the second study area, the differences are smaller. The local-specific Pleiades model has MAE = 3.32 m and RMSE = 4.36 m, while the multi-site joint model has MAE = 3.13 m and RMSE = 4.36 m. These results suggest that local training can be slightly more accurate when local data are strong, but multi-site training can still produce acceptable results and may improve generalizability as more diverse training samples become available.
The advantages of the proposed method are practical. First, it avoids the need for building instance segmentation and roof-to-footprint offset vectors, which are often difficult to produce at scale. Second, it uses original off-nadir images instead of true-orthorectifying all training images, which helps keep training and prediction images consistent. Third, the DA-cGAN attention mechanism improves the model’s ability to learn building-related features across time. Fourth, the post-processing steps address both local seam artifacts and global height bias. Together, these design choices make the method suitable for historical or multi-temporal height estimation when full height data do not exist for the target year.
The study’s strongest contribution is the combination of geometric reasoning and deep learning. The authors do not simply feed satellite images into a neural network and expect the model to solve everything. They first correct the geometric relationship between off-nadir imagery and height data using Los-nDSM. Then they use DA-cGAN to learn image-to-height mapping under bi-temporal conditions. Then they refine and calibrate the output. This layered design is why the method performs better than a single-temporal deep learning baseline.
The limitations are also important. The study uses two Beijing areas with high-quality WorldView-2 and Pleiades images. Performance may decline if images have poorer quality, stronger cloud or haze contamination, inconsistent shadows, large seasonal differences, or more severe registration errors. The authors also note that evaluation is limited to two study areas because LiDAR data are scarce. More testing is needed across different cities, building styles, climates, sensors, and urban morphologies.
Another limitation is that the method estimates height maps but does not fully reconstruct building components. It does not directly solve semantic segmentation of roofs, facades, and building footprints. The authors suggest that future work could integrate building component extraction or multitask learning for more accurate 3D building reconstruction. This is important because height estimation is one part of 3D urban modeling; complete 3D reconstruction also requires building outlines, roof shapes, facade geometry, and object-level consistency.
The results should also be interpreted as preprint evidence. The PDF explicitly states that the research paper has not been peer reviewed. The method is technically promising and quantitatively strong in the reported experiments, but it still requires peer review, replication, and broader validation before being treated as a mature standard for operational urban mapping.
For urban planning, the method’s potential is significant. Historical building height maps can help planners understand where vertical growth occurred, how redevelopment changed urban density, and whether planning controls preserved or transformed the urban skyline. In Beijing, this is especially relevant because the historic urban core and Tongzhou New City represent different development regimes: one constrained by heritage and height control, the other shaped by recent administrative and commercial development.
For disaster assessment, historical building heights can improve exposure models. Flood risk, earthquake vulnerability, urban heat, wind exposure, evacuation planning, and damage assessment all depend on three-dimensional building form. A 2D map may show where buildings are located, but height data help estimate population density, floor area, vertical exposure, and structural concentration.
For environmental research, 3D urban form affects surface urban heat island effects, energy demand, shading, ventilation, carbon emissions, and land-use efficiency. A method that reconstructs building heights over time can support studies of how urban morphology influences climate and resource use. This is especially valuable in rapidly urbanizing regions where historical height records may be incomplete.
The broader meaning of the study is that archived satellite imagery contains more three-dimensional information than is immediately visible. Off-nadir images are often treated as problematic because buildings tilt and height labels misalign. This paper turns that problem into a source of information by matching height data to the image’s line of sight and training a model that learns from bi-temporal geometry. If validated more broadly, this approach could help reconstruct the vertical history of cities from existing remote sensing archives.
Source and Method Note
The source analyzed here is A Novel Method for Estimating Urban Building Heights Using Bi-temporal High Resolution Satellite Imagery and Reprojected nDSM by Xiaoxue Feng, Peijun Li, Fang Chen, and Changyong Dou. The authors are affiliated with the Aerospace Information Research Institute of the Chinese Academy of Sciences, the International Research Center of Big Data for Sustainable Development Goals, Peking University’s Institute of Remote Sensing and GIS, and the Beijing Key Laboratory of Spatio-temporal Perception and Urban Resilience.
The PDF explicitly states “This preprint research paper has not been peer reviewed” and “Preprint not peer reviewed.” It is therefore a non-peer-reviewed SSRN preprint research paper. Its results should be interpreted as non-peer-reviewed preprint evidence, not as a finalized peer-reviewed remote-sensing standard.
The study proposes a three-stage method for estimating building heights in a target temporal period using bi-temporal high spatial resolution off-nadir satellite images and local reference-date nDSM data. The stages are: generation of bi-temporal Line-of-Sight nDSMs, target-temporal building height estimation using a dual-attention conditional Generative Adversarial Network, and post-processing through local height optimization plus height calibration.
The study uses two Beijing study areas. The first is the main urban center of Beijing, approximately 24 km², using WorldView-2 images from 2013 and 2017. The second is Tongzhou New City, approximately 146 km², using Pleiades images from 2013 and 2023. LiDAR-derived nDSM data from local reference areas are used for training, while stereo pair-derived or BJ-3 derived nDSM data are used for evaluation where historical LiDAR is unavailable.
The method includes several technical components. The nDSM is reprojected into the viewing direction of off-nadir satellite imagery to create Los-nDSM labels that are geometrically consistent with building roofs and facades in the image plane. The DA-cGAN model uses a U-Net-like generator with CBAM-based dual attention and a PatchGAN discriminator. Local height optimization reduces seam artifacts from patch-based prediction. Height calibration uses pseudo height-invariant points selected with PCMV texture, NDVI, blue band filtering, Monte-Carlo Cross Validation, and weighted least squares linear correction.
The paper’s key visuals and tables include Figure 1 on page 5 showing the two Beijing study areas; Table 1 on page 6 listing bi-temporal satellite image parameters; Figure 2 on pages 8–9 showing WorldView-2 images and nDSM data for the first study area; Figure 3 on pages 10–11 showing Pleiades and nDSM data for the second study area; Figure 4 on page 11 showing the stereo pair and generated nDSM for evaluation; Figure 5 on page 12 showing the full method flowchart; Figure 6 on page 13 showing the target-temporal height estimation procedure; Figure 7 on page 18 demonstrating Los-nDSM alignment with off-nadir images; Figure 8 on page 19 showing PCMV texture for pseudo height-invariant point selection; Figure 9 on page 21 showing ablation results; Figure 10 on page 23 showing scatterplots; Figure 11 on page 24 comparing the proposed method with a single-temporal method; Figures 12–14 on pages 26–29 showing second-area results; and Tables 3–6 on pages 22, 25, 28, and 30 reporting accuracy assessments.
The main numerical findings are as follows. In the first study area, the proposed method achieves MAE = 2.42 m, RMSE = 3.37 m, ZNCC = 0.9444, and RB = -3.90%, reducing MAE and RMSE by 3.55 m and 5.91 m compared with the single-temporal comparative method. In the second study area, for unchanged buildings, the proposed method achieves MAE = 2.49 m, RMSE = 3.71 m, ZNCC = 0.8871, and RB = -2.34%, reducing MAE and RMSE by 3.29 m and 4.04 m compared with the comparative method. For high-rise unchanged buildings in the second area, MAE is reduced from 10.55 m to 5.99 m and RMSE from 12.92 m to 7.56 m.
This article is not an official urban planning decision, cadastral record, engineering certification, disaster-risk certification, regulatory approval, legal land-use document, investment advice, or official government mapping product. It explains a research method and its experimental validation. Because the source is a non-peer-reviewed preprint, the method should be validated further through peer review, replication in more cities, additional sensors, broader LiDAR reference datasets, and operational testing before being used as authoritative mapping infrastructure.