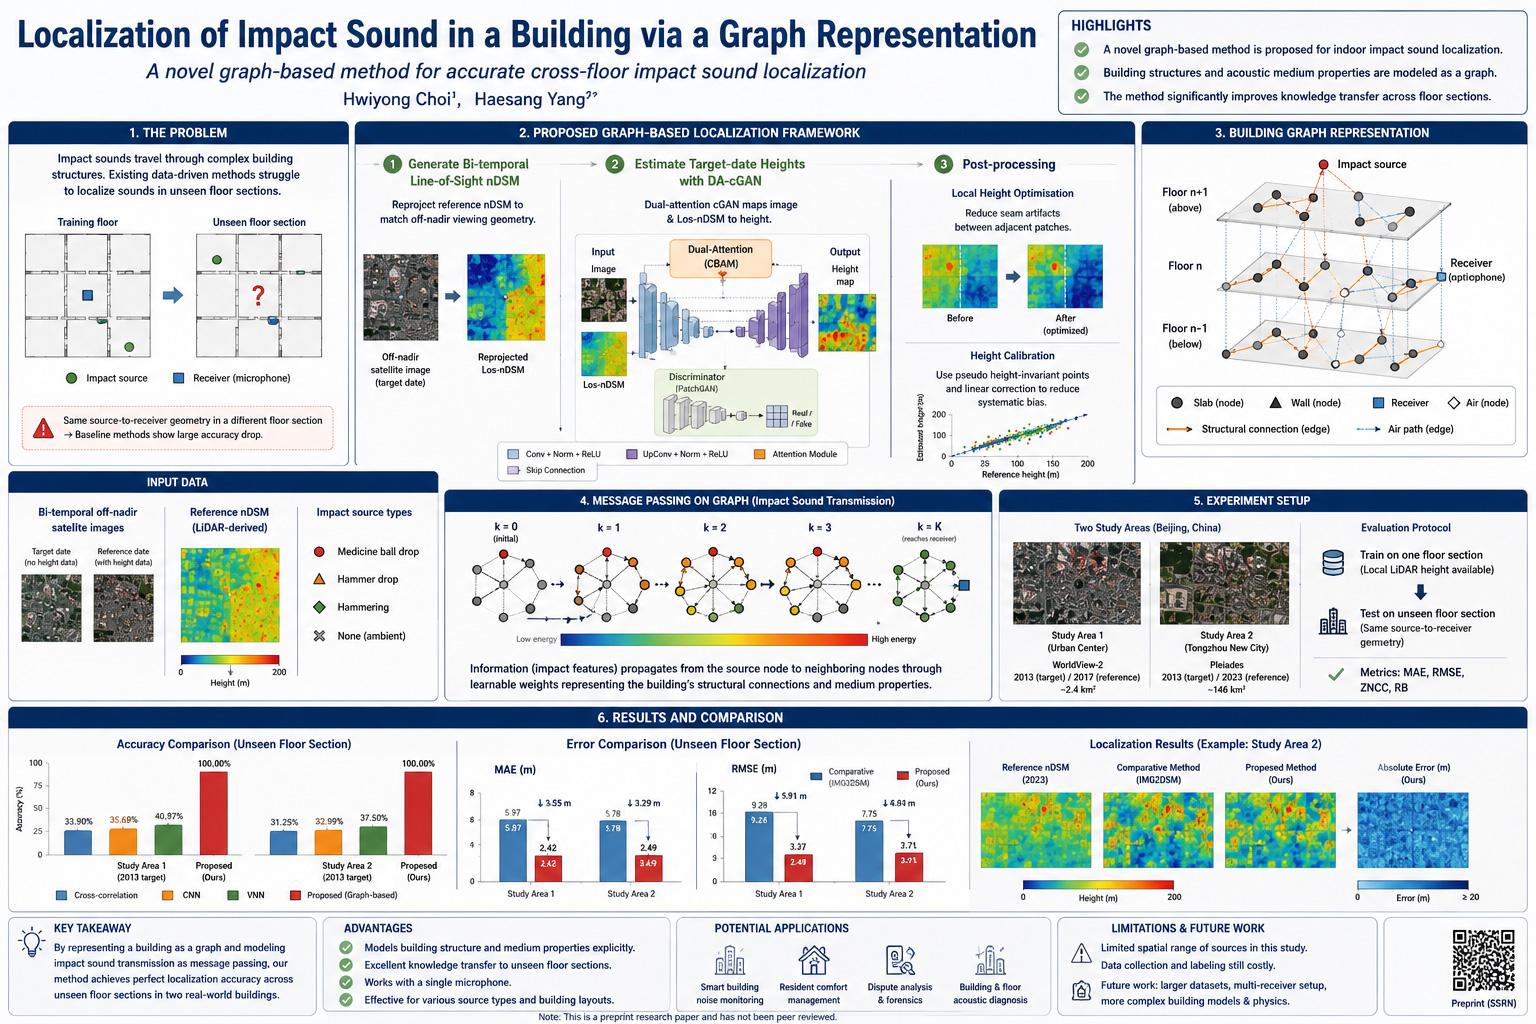
The study addresses a very practical problem in building acoustics: when an impact sound is heard inside a building, where did it come from? This question matters in apartments, offices, smart buildings, campus buildings, and residential structures where impact noises can disturb occupants. In daily life, people may hear a bang, a dropped object, a hammering sound, or footsteps from another floor and wonder whether it came from above, below, or from a neighboring room. For building managers, acoustic engineers, and smart-building systems, automatic localization of such sounds could support noise diagnosis, occupant comfort, monitoring, and automated response.
Impact sound localization is difficult because buildings are not acoustically simple environments. A sound does not travel only through air. In reinforced concrete buildings, impact energy can travel through slabs, walls, columns, beams, and connected structural components. A sound generated on one floor may be transmitted through solid materials before it reaches a receiver. The same impact type can produce different recorded signals depending on the building path, floor section, source-receiver relationship, and structural medium. Therefore, a method that ignores the building structure may learn patterns that work only in the specific floor area where training data were collected.
The research motivation comes from this limitation. The authors refer to their previous learning-based work on inter-floor noise and impact sound localization. Those methods could identify the floor level or localize sounds near trained positions, but they struggled when asked to generalize to floor sections not included in the training data. In other words, the model could learn the sound-source relationship in one part of the building, but this knowledge did not transfer reliably to another structurally similar section. This is a major weakness for real-world use, because collecting labeled impact sound data in every room and every floor section is expensive and impractical.
The paper’s main contribution is to represent the building as a graph. In this graph, structural components are modeled as vertices, and the physical or acoustic connections between them are modeled as edges. Instead of treating impact sound localization as only a signal classification problem, the proposed method incorporates the geometry and medium properties of the building into the localization process. This is the key conceptual shift: the building is not just the place where sound happens; it becomes part of the computational model.
Figure 1 on page 5 is one of the most important visuals in the paper. It shows how a reinforced concrete building is transformed into a graph representation. The diagram includes slabs, walls, air, and a receiver node. A sound source node receives an encoded impact sound signal, while non-source nodes receive an ambient or random initial state. Each node also carries attributes such as medium type, coordinates, relative floor, and source type. This figure helps readers understand the central idea: impact sound is localized not only by comparing waveforms, but by simulating how sound-related features move through a graph that resembles the building structure.
The graph representation is designed around two types of node states. For the source node, the initial state includes an encoded representation of the raw impact signal and the node attributes. For non-source nodes, the initial state includes a random ambient vector and the node attributes. This distinction is important because the model needs to know where the impact begins, while all other structural components act as possible transmission media or receiver-related components.
The raw impact sound signal is encoded using a subset of SoundNet. SoundNet is a neural-network-based audio representation model originally designed to learn sound features. In this study, the encoder processes the impact signal and reduces it into a feature representation suitable for graph-based transmission modeling. The point is not simply to use the raw audio waveform directly, but to convert it into a compact representation that can be propagated across the building graph.
Figure 2 on page 6 shows impact sound transmission through message passing on the graph. The figure illustrates three stages: k = 0, k = 1, and k = 2. At k = 0, energy is concentrated at the source node. As message passing proceeds, the energy spreads to neighboring nodes. The diagram uses darker and lighter node colors to represent higher and lower energy levels. This figure is useful because it translates an abstract graph-learning process into a physical intuition: impact energy moves through connected building components over discrete transmission steps.
The message-passing process has two main parts: aggregation and state update. During aggregation, a node receives information from its neighboring nodes. During the update step, the node combines the aggregated neighbor information with its previous state. This mirrors the idea that sound transmission in buildings depends both on incoming energy from connected components and on the current condition or identity of the receiving component.
Figure 3 on page 7 explains this aggregation and update process mathematically and visually. Figure 3(a) shows how neighboring node states are transformed using learnable weight matrices and then aggregated. Figure 3(b) shows how the aggregated neighborhood information is combined with the previous state of the node, passed through a learnable transformation, and normalized. This is the technical heart of the graph model: the model learns how sound-like information should move from one structural component to another.
The attributes used in the graph are summarized in Table 2 on page 8. The selected attributes include structural component type, position relative to the receiver, relative floor, and source type. Structural components are encoded as slab, wall, or air using one-hot encoding. The position is represented by Cartesian coordinates [x, y, z]. The relative floor is encoded as above, same, or below. Source types include medicine ball drop, hammer drop, hammering, and none. This table is important because it shows that the method does not rely on audio alone. It explicitly tells the model whether a node is slab, wall, or air, where it is located, how it relates to the receiver floor, and what kind of impact source is involved.
This is also where the method differs from ordinary supervised learning. A conventional CNN may learn that a particular audio pattern corresponds to a particular source position, but it does not inherently know the building structure. The graph model receives structural context. It knows that sound must travel through connected building elements, and it can learn transmission weights that reflect this pathway. That is why the authors expect better knowledge transfer across floor sections.
Figure 4 on page 8 visualizes the graph representation and edge simplification. Figure 4(a) shows a building graph decomposed into room-scale components, with floors and interconnections. Figure 4(b) highlights source positions and downward transmission paths. Figure 4(c) simplifies the graph by showing only the shortest paths between a source node and a receiver node, while dimming excluded edges. This simplification matters because a real building graph can become very complex. By focusing on shortest paths within a defined message-passing depth, the model reduces computational and structural complexity while retaining the most relevant transmission paths.
The edge simplification is not a claim that real sound always travels only along one shortest path. Buildings can have complex multi-path vibration and acoustic transmission. Rather, the simplification is a modeling decision. It makes the graph manageable and focuses the learning process on physically meaningful connections. This is a reasonable first step, but it is also one of the places where future work could improve the model by adding richer path structures, material properties, damping behavior, and multi-path transmission effects.
Figure 5 on page 9 explains how the building graph is optimized using actual measured impact sounds. The authors collect impact sound samples from known positions and use the relationship between measured sounds and graph-propagated responses to optimize the learnable weights. In plain language, the model learns how the building transmits impact sound by comparing what the graph predicts at the receiver node with what was actually recorded. The optimized weights then become a learned representation of the building’s transmission behavior.
The optimization objective is described in Equation 4. The model searches for weights that minimize the loss between the encoded actual impact sound and the final receiver-node state after message passing. The final receiver state excludes receiver attributes when calculating loss. This is important because the model is learning transmission behavior, not merely memorizing receiver metadata. The learned graph weights represent how impact information is transformed as it travels from source node to receiver node.
Figure 6 on page 10 shows the localization process after optimization. The method creates a collection of graph responses for candidate source locations. When a new impact sound is recorded, its encoded representation is compared with these candidate responses. The predicted source location is the node whose graph response is most similar to the new sound embedding. This is conceptually similar to nearest-neighbor matching, but the reference space is not raw audio; it is a graph-informed response space shaped by building geometry and learned transmission weights.
The experiments use real-world data from actual reinforced concrete buildings. The main validation dataset is APT II, while SNU-B36-50E is used for pretraining the embedding model. The APT II dataset contains impact sound recordings generated above or below a receiver in a reinforced concrete building. The SNU-B36-50E dataset contains approximately 2,300 audio recordings from 19 source locations in a campus building at Seoul National University. This two-dataset structure allows the authors to combine a larger pretraining source with a more specific reinforced-concrete apartment-style test setting.
The appendix gives important dataset details. Figure A.1 on page 15 shows the floor plan and building elevations used for constructing the APT II dataset. Source positions are marked by circles, and receiver positions are marked by squares. The floor plan shows source points such as 2-A, 2-B, 2-C, and 2-D, while the elevation diagrams show receiver positions on different floors. This figure matters because the experiment is not performed in an abstract simulation; it uses real source and receiver configurations in a building.
Table A.1 on page 16 summarizes the dataset subsets. In APT II, one subset uses source positions 2-A, 2-B, 2-C, and 2-D with the receiver on the fifth floor. Another uses the same source positions with the receiver on the third floor. A third subset uses positions 2-A′, 2-B′, 2-C′, and 2-D′ with the receiver on the fourth floor. The SNU-B36-50E dataset includes source positions across the third, second, and first floors with a receiver on the second floor. This structure is directly connected to the knowledge-transfer problem: the model must deal with similar source-to-receiver relationships appearing in different floor sections.
The study evaluates two main tasks. The first task tests localization of impact sound sources on a floor seen during training. This measures basic localization accuracy under familiar conditions. The second task tests localization on an unseen floor. This is the more important task because previous methods struggled under this condition. If a model cannot transfer from one floor section to another, it is less useful for real buildings where exhaustive training data are unavailable.
The authors compare the proposed graph-based locator against several baselines. The first baseline is cross-correlation, which compares a new measurement against training signals and selects the position with the highest similarity. Cross-correlation is simple and interpretable, but it does not incorporate building geometry. It can work when signal shapes remain similar, but it can struggle when the same physical relationship produces different waveform distributions across floor sections.
The second baseline is a convolutional neural network based on SoundNet-style processing. This model extracts features from raw audio and performs supervised localization. Such a model can perform well on data similar to its training distribution, but it may not know why two floor sections with similar geometry should be related. It learns acoustic patterns, not structural transmission pathways.
The third baseline is a vanilla neural network with similar input and comparable parameter count to the graph-based model, but without explicit graph structure. This is an important baseline because it checks whether the improvement comes simply from giving the model more attributes or more parameters. If a non-graph neural network with similar input cannot transfer well, then the graph representation itself is likely responsible for the improvement.
Table 3 on page 12 reports the main accuracy results. On validation data from the trained floor section, cross-correlation reaches about 93.06–94.44% accuracy across five splits. The CNN reaches 93.75–100.00%. The VNN varies more widely, from 26.39% to 53.47%. The proposed graph method reaches 100.00% on all five validation splits. These validation results already show strong performance, but the unseen-floor test results are more revealing.
On unseen-floor test data, the baseline methods degrade sharply. Cross-correlation reaches only about 29.31–34.44%. The CNN reaches about 29.44–37.64%. The VNN varies between 25.00% and 50.00%. In contrast, the proposed graph method reaches 100.00% accuracy on all five test splits. This is the paper’s strongest numerical result. It suggests that structural graph representation dramatically improves knowledge transfer across floor sections in the tested dataset.
These numbers should be interpreted carefully. A 100% result is impressive, but the dataset appears limited in spatial range and number of source positions. The paper itself acknowledges that the spatial range of source positions around the receiver remains limited. Therefore, the result should not be generalized to all buildings, all sound types, all receiver placements, or all structural systems without further testing. Still, within the reported experiment, the improvement over baseline methods is very large and directly supports the authors’ core claim.
Figure 7 on page 13 provides t-SNE visualizations of the filtered datasets produced by the VNN, CNN, and graph-based locator. The validation visualizations show that the VNN has confusion among some categories, while the CNN and graph method separate categories more clearly. The test visualizations are more important: VNN and CNN outputs show unclear separation and misclassification under the shifted floor-section condition, while the graph method maintains clear category separation. This visual evidence supports the accuracy table by showing that the graph model creates a more transferable representation space.
Figure 8 on page 14 visualizes energy propagation on the optimized graph for message-passing depths k = 1, 2, 3, and 4. Each column corresponds to a different source node. As k increases, energy progressively transfers from source nodes toward the receiver. The color scale indicates high and low energy levels. This figure is valuable because it makes the learned graph process interpretable. It shows not only the final answer, but also how impact sound information spreads through the graph over message-passing steps.
The study’s strongest scientific contribution is the integration of structural context into learning-based acoustic localization. Instead of treating the building as a black box and the audio signal as the only useful input, the method encodes the building’s geometry and structural media. This makes intuitive sense: impact sound transmission is governed by physical paths, not only by waveform similarity. By respecting that structure, the model transfers better across floor sections.
The practical implications are significant for smart buildings. A system that can localize impact sounds using a single receiver and structural graph information could help identify sources of disturbing noise, support neighbor-dispute diagnosis, improve building acoustic monitoring, and contribute to automated occupant-comfort systems. In apartment buildings, inter-floor noise is a major quality-of-life issue. A more reliable localization method could help distinguish whether a sound came from directly above, an adjacent space, or another structurally connected area.
However, the study does not prove that a fully deployable commercial system is ready. The authors emphasize several limitations. First, the method is still data-driven and requires substantial effort for data collection and labeling. Real buildings vary widely in floor plans, construction quality, material properties, finishes, furniture, and acoustic boundary conditions. A method trained in one building may still need adaptation before being used elsewhere.
Second, the spatial range of source positions around the receiver is limited. The experiments focus on specific source positions such as 2-A, 2-B, 2-C, and 2-D and corresponding primed positions. A real building may have many more possible impact locations. It remains to be tested whether the method scales to larger floor plans, more rooms, more floors, multiple receiver locations, and more complex source-receiver configurations.
Third, the model simplifies the graph to shortest paths. This is practical, but real impact sound can travel through multiple structural and airborne paths. Reflections, damping, material heterogeneity, furniture, floating floors, floor coverings, and wall junctions may all affect transmission. Future work could improve realism by adding richer physical attributes, material stiffness, damping coefficients, slab thickness, wall types, and measured transfer functions.
Fourth, the study’s reported result depends on non-peer-reviewed preprint evidence. The approach is promising, but independent replication and peer review are needed. It would be useful to test the method in multiple buildings, with more source types, different sensors, multiple construction systems, and real residential noise events rather than only controlled impact sources.
The future research directions suggested by the authors include reducing data dependency through few-shot or unsupervised learning and expanding the dataset to cover more source-to-receiver configurations. This is important because the biggest practical barrier to supervised acoustic localization is labeled data. If a graph-based method can learn from fewer labeled impacts, it could become much more useful in real buildings.
The broader meaning of the study is that sound localization in buildings should not be separated from building structure. A building is not just a container for sound; it is a transmission network. Slabs, walls, air cavities, floors, and receiver positions create pathways that shape the signal before it reaches the sensor. By turning that network into a graph, the authors give the learning model a structural memory of the building. That is why the method can transfer knowledge across floor sections better than baselines that rely mainly on audio similarity or standard neural classification.
In everyday terms, the study suggests a smarter way to answer a familiar question: “Where did that noise come from?” Instead of relying only on how the sound waveform looks at the receiver, the model asks how the building itself would carry that sound from possible sources to the receiver. That structural awareness is the main reason the graph-based approach is scientifically interesting and practically relevant.
Source and Method Note
The source analyzed here is Localization of impact sound in a building via a graph representation by Hwiyong Choi and Haesang Yang. The listed affiliations are Avikus Co., Ltd. within HD Hyundai Group and the Department of Artificial Intelligence and Robotics at Sejong University in South Korea.
The PDF explicitly states “This preprint research paper has not been peer reviewed” and “Preprint not peer reviewed.” It also provides an SSRN electronic copy link. Therefore, the source type is a non-peer-reviewed SSRN preprint research paper. The results should be interpreted as non-peer-reviewed preprint evidence, not as a finalized peer-reviewed acoustic engineering standard or certified building-noise monitoring system.
The study proposes a graph-based impact sound localization method. Reinforced concrete building components such as slabs, walls, and airspaces are modeled as graph vertices, while physical connections between components are modeled as edges. Node attributes include structural component type, relative position to receiver, relative floor, and source type. The raw impact signal is encoded using a SoundNet-derived encoder, and impact sound transmission is modeled through graph message passing.
The method is tested using real-world data from reinforced concrete buildings. The APT II dataset contains impact sound recordings generated at source positions above or below a receiver in an actual reinforced concrete building. The SNU-B36-50E dataset includes approximately 2,300 recordings from 19 source locations in a campus building and is used for pretraining the embedding model. The experiments compare the proposed graph locator with cross-correlation, CNN, and vanilla neural network baselines.
The key visuals and tables include Figure 1 on page 5, which shows the transformation of a reinforced concrete building into a graph; Figure 2 on page 6, which shows impact sound propagation through graph message passing; Figure 3 on page 7, which explains aggregation and node-state updating; Table 2 on page 8, which lists node attributes and representations; Figure 4 on page 8, which shows graph simplification and shortest paths; Figure 5 on page 9, which shows optimization using actual impact sounds; Figure 6 on page 10, which shows the localization process; Table 3 on page 12, which reports accuracy across validation and unseen-floor test splits; Figure 7 on page 13, which shows t-SNE visualization of locator outputs; Figure 8 on page 14, which visualizes energy propagation across message-passing steps; Figure A.1 on page 15, which shows source and receiver positions in the APT II dataset; and Table A.1 on page 16, which summarizes dataset subsets.
The main numerical finding is that the proposed graph-based locator achieves 100.00% accuracy across all reported validation and unseen-floor test splits in Table 3. Baseline methods perform well or moderately under validation conditions but degrade strongly on unseen-floor test data: cross-correlation falls to roughly 29.31–34.44%, CNN to roughly 29.44–37.64%, and VNN to roughly 25.00–50.00%. This supports the authors’ claim that graph-based structural representation improves knowledge transfer across floor sections.
This article is not a building-code approval, acoustic certification, legal evidence standard, engineering safety approval, surveillance deployment recommendation, housing-dispute judgment, or official policy directive. It explains a research method and its experimental results. Because the paper is a non-peer-reviewed preprint and the dataset scope is limited, the results should be validated through peer review, larger datasets, more buildings, more source positions, more receiver configurations, and real operational acoustic monitoring tests before practical adoption.