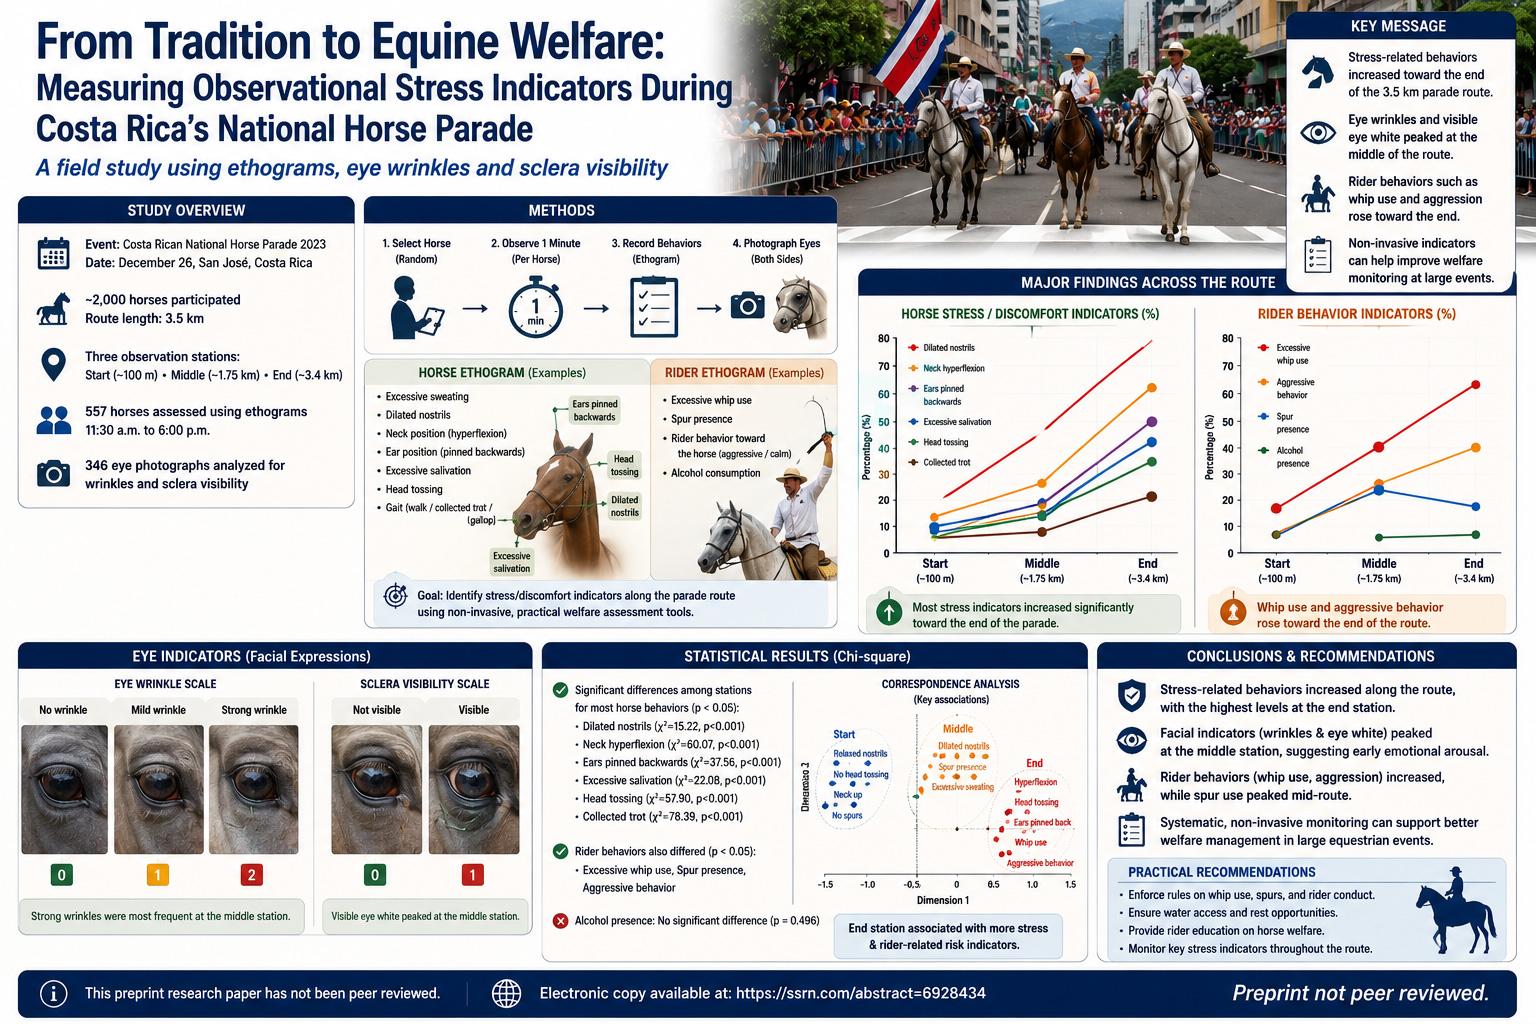
A non-peer-reviewed preprint study examines observational indicators of stress and discomfort in horses participating in the Costa Rican National Horse Parade 2023. The event involved approximately 2,000 horses walking a 3.5 km route through San José, with crowds, music, speakers, platforms, riders, and prolonged environmental stimulation. Researchers observed 557 horses at three points along the route—Start, Middle, and End—and analyzed 346 eye photographs to classify eye wrinkles and visible eye white as non-invasive indicators of emotional arousal.
The study reports a progressive increase in several stress-associated whole-body behaviors toward the end of the route, including dilated nostrils, neck hyperflexion, ears pinned backwards, excessive salivation, head tossing, and collected trot. Rider-related indicators also changed along the route: excessive whip use and aggressive rider behavior increased toward the end, while spur presence peaked at the middle station. Facial indicators showed a different temporal pattern: strong eye wrinkles and visible eye white were most prominent at the middle station, suggesting a peak in emotional arousal earlier than the peak in cumulative fatigue-related behaviors. The study is valuable because it shows how field-applicable welfare tools can identify stress patterns during cultural equestrian events, but because it is a preprint and observational study, it should be interpreted cautiously and not treated as final regulatory guidance.
This study focuses on a sensitive and practically important question: how can traditional equestrian public events be evaluated through the lens of animal welfare without dismissing their cultural importance? The Costa Rican National Horse Parade is an annual event held in San José on December 26 to commemorate Costa Rican Horse Riders Day. According to the manuscript, approximately 2,000 horses participate, following a route of about 3.5 km from midday to early evening. The environment includes spectators, music, speakers, narrators, platforms, and the social intensity typical of a large public celebration.
The welfare concern is not abstract. The authors note that animal advocacy groups have raised concerns about unapproved spurs, careless unloading and transportation, restricted access to water and food, loud music and noise, and improper behavior by inexperienced or intoxicated riders. These concerns create the ethical motivation for the study. The research does not argue that tradition and welfare must be enemies. Instead, it asks whether observable, non-invasive indicators can help identify when and where horses show signs of stress or discomfort during the event.
The study’s approach is important because welfare assessment in a live public parade cannot easily rely on invasive sampling. Physiological markers such as blood cortisol or salivary cortisol can be useful in controlled research, but collecting them during a crowded moving parade would be difficult, disruptive, and potentially stressful in itself. The authors therefore use behavioral ethograms, facial-expression measures, eye wrinkles, and sclera visibility. These tools are field-applicable because they allow trained observers to record visible indicators without touching or interfering with the animals.
An ethogram is a structured list of species-specific behaviors recorded objectively and consistently. In this study, the horse ethogram included excessive sweating, nostril position, neck position, ear position, salivation, head tossing, and gait. The rider ethogram included excessive whip use, spur presence, rider behavior toward the horse, and alcohol consumption. This structure matters because it turns casual observation into systematic data. Instead of saying “some horses looked stressed,” the study records defined indicators at defined route locations.
The study design was prospective and observational. This means the researchers observed and recorded a predefined cohort during the event but did not intervene, assign treatments, manipulate rider behavior, or control the parade environment. That design is appropriate for field welfare monitoring, but it also limits causal interpretation. If stress indicators increase toward the end of the route, the study can show an association with parade progression, but it cannot prove that one single factor—such as crowd noise, rider behavior, fatigue, gait, or equipment—caused the increase by itself.
The event route was divided into three observation stations. The Start station was located at approximately 100 meters, the Middle station at approximately 1.75 km, and the End station at approximately 3.4 km. At each station, trained observers randomly selected horses and observed each horse for one minute. In total, 557 horses were assessed using ethological methods between 11:30 a.m. and 6:00 p.m. This gave the study broad field coverage across the full parade duration, although the same horse was not necessarily followed continuously from start to finish.
Table 1, shown on pages 3 and 27, defines the horse indicators. Excessive sweating was recorded when the coat was covered with sweat over the entire body, possibly dripping. Dilated nostrils were interpreted as widened nostrils indicating potential respiratory difficulty. Neck hyperflexion was defined as the horse curling its neck and bringing the muzzle close to the chest, with the face behind the vertical. Ears pinned backwards were defined as ears flat and horizontally directed backward. Excessive salivation was recorded as excessive foam in the mouth. Head tossing was defined as repeated up-and-down head movement. Gait categories included walk, collected trot, and gallop.
These definitions are essential because each behavior can have multiple meanings depending on context. For example, sweating may reflect heat dissipation during exercise, not necessarily psychological stress alone. Dilated nostrils may reflect physical effort, respiratory demand, arousal, or stress. Ears pinned backward may indicate discomfort, irritation, pain, or response to aversive stimuli. Neck hyperflexion may reflect rider control, equipment, trained posture, or conflict. By using a defined ethogram, the authors make the observations more reproducible, but interpretation still requires caution.
Table 2, shown on pages 4 and 28, defines rider-related indicators. Excessive whip use was recorded when the rider struck the horse strongly several times. Spur presence was recorded simply as whether the rider wore spurs. Rider behavior was classified as aggressive if the rider yelled, overrode, annoyed, or hit the horse; calm behavior was defined as serene handling without aggression. Alcohol consumption was recorded when the rider carried or drank alcoholic beverages during the event. Importantly, the study could observe spur presence but not necessarily active spur use, which is a key limitation.
Eye-based indicators were evaluated separately from whole-body behavior. Photographs of horses’ eyes were collected at all three observation stations from both sides of the street. From the total photographic dataset, 346 images of optimal quality were selected. The researchers classified eye wrinkles using a three-level scale: no wrinkle, mild wrinkle, and strong wrinkle. They also classified sclera visibility, meaning whether the white of the eye was visible. Figures 1 and 2, shown on pages 4, 21, and 22, illustrate these classification scales using field photographs.
Eye wrinkles and sclera visibility are useful because they may reflect facial muscle tension and emotional arousal. However, they are not perfect stress meters. Sclera visibility can be influenced by breed type, eye shape, head angle, camera angle, and individual morphology. Eye wrinkles may differ between horses even under similar conditions. The study recognizes this by treating facial indicators as part of a broader welfare assessment rather than as standalone proof of stress.
The statistical analysis used contingency tables, Chi-square tests of independence, and post hoc two-proportion z-tests with Bonferroni correction. These tests asked whether the frequency of each behavior differed significantly among the Start, Middle, and End stations. When expected counts were low, Fisher’s exact test was used to confirm results. The study also used correspondence analysis to explore associations between route location and categories of horse behavior, physiological indicators, and rider characteristics. Eye wrinkles and sclera visibility were also analyzed with Chi-square tests and pairwise comparisons.
The main result is that several horse stress or discomfort indicators increased as the route progressed. Figure 3 on pages 6 and 23 visualizes this trend. The graph shows multiple indicators across the Start, Middle, and End stations. Dilated nostrils increased along the route and reached high levels at the End station. Neck hyperflexion, ears pinned backwards, excessive salivation, collected trot, and head tossing also increased toward the End station. This pattern suggests that the final phase of the parade was associated with greater physical and behavioral strain.
Table 3, shown on pages 8 and 29, provides the statistical evidence. Dilated nostrils differed significantly among stations, with χ² = 15.22, df = 2, and p < 0.001. Neck position showed a strong station association, with χ² = 60.07, df = 4, and p < 0.001. Ears pinned backwards differed significantly, with χ² = 37.56, df = 2, and p < 0.001. Excessive salivation differed significantly, with χ² = 22.08, df = 2, and p < 0.001. Head tossing also differed significantly, with χ² = 57.9, df = 2, and p < 0.001. Collected trot showed the strongest chi-square value among the listed horse behaviors, with χ² = 78.39, df = 2, and p < 0.001.
Excessive sweating was the exception. It did not differ significantly among stations, with χ² = 3.29, df = 2, and p = 0.193. This does not mean sweating was absent or unimportant. The authors suggest that sweating may have been common across the entire event because horses were exercising, thermoregulating, and often performing collected trot. Since sweating is the primary cooling mechanism during exercise, it may be less sensitive to route position than behaviors such as head tossing, neck hyperflexion, or ear position.
The collected trot finding deserves special attention because it may help explain several other changes. The manuscript defines collected trot as a lateral-sequence four-beat, laterally coupled gait with an isochronal beat pattern and often three limbs in stance phase simultaneously. The authors argue that this gait can impose considerable cardiorespiratory demand, even if it appears controlled or “soft” to observers. Previous cited work suggests high heart rates and oxygen consumption during similar gaits. In this parade, collected trot increased toward the End station, which may have contributed to dilated nostrils, salivation, fatigue-related behaviors, and increased rider intervention.
Neck hyperflexion is another major welfare concern. The study reports that 46% of horses at the End station presented hyperflexed necks. Hyperflexion places the horse’s face behind the vertical and can interfere with normal movement and comfort. The discussion connects this posture to prior welfare literature showing concern about horses working in hyperflexed positions. The study does not prove that every observed hyperflexed posture was forced or harmful, but the progressive increase toward the end raises a serious management question: were horses increasingly being held in restrictive positions as fatigue, crowding, or rider control demands increased?
Ears pinned backwards and head tossing also increased toward the End station. These behaviors are commonly interpreted as signs of discomfort, irritation, conflict, or response to aversive stimulation. Their increase alongside aggressive rider behavior and whip use suggests a possible escalation in horse-rider conflict as the event progressed. However, causality cannot be assigned from the observational data alone. A horse may toss its head because of fatigue, bit pressure, rein tension, noise, crowding, pain, frustration, or rider aids. The value of the study is that it identifies where these behaviors become more frequent, not that it proves one cause for each behavior.
Excessive salivation also increased toward the End station. The authors explain that salivation and foaming during ridden events may result from mechanical and physiological factors associated with bit use and rein tension. The bit can stimulate sensitive oral tissues, affect swallowing patterns, and allow saliva to accumulate and foam. This interpretation is plausible, but the study did not directly measure rein tension, bit type, mouth lesions, swallowing frequency, or oral pain. Therefore, excessive salivation should be interpreted as a possible welfare indicator requiring further investigation, not as direct proof of a specific oral mechanism.
Rider behaviors showed a concerning pattern. Figure 4 on pages 7 and 24 shows rider-related indicators across the route. Excessive whip use increased toward the End station. Aggressive rider behavior also increased toward the End station. Spur presence peaked at the Middle station and then decreased somewhat at the End. Alcohol presence did not differ significantly among stations, suggesting a relatively uniform distribution along the route.
Table 3 gives the statistical results for rider behavior. Excessive whip use differed significantly across stations, with χ² = 24.84, df = 2, and p < 0.001. Spur presence also differed significantly, with χ² = 29.56, df = 2, and p < 0.001. Aggressive rider behavior differed significantly, with χ² = 46.85, df = 2, and p < 0.001. Alcohol presence did not differ significantly, with χ² = 1.4, df = 2, and p = 0.496. These results support the interpretation that rider control behaviors became more forceful as the route progressed, although the study cannot separate rider fatigue, horse fatigue, crowd influence, training differences, or individual temperament.
The correspondence analysis adds a useful multidimensional view. Figure 5 on pages 9 and 25 shows three biplots linking station location to horse physiological variables, horse posture and movement variables, and rider behavior variables. The Start station was associated with relaxed nostrils, normal salivation, no excessive sweating, neck upward position, no head tossing, no spurs, and alcohol carrying. The Middle station was associated with dilated nostrils, excessive sweating, normal neck position, non-backward ear positions, and spur presence. The End station was associated with excessive salivation, neck hyperflexion, head tossing, ears pinned backwards, whip use, and aggressive riding.
This correspondence analysis is important because it shows that route progression was not associated with one isolated change. Instead, the End station clustered with several whole-body and rider-related indicators of discomfort, exertion, or conflict. That supports the authors’ broader claim that welfare pressure intensified as the parade advanced. At the same time, correspondence analysis is descriptive and associative; it should not be read as proof of causal pathways.
The facial-expression results are especially interesting because they did not follow the same pattern as the whole-body indicators. Figure 6 on pages 10 and 26 shows wrinkle intensity and visible eye white across stations. Mild wrinkles and visible eye white differed significantly between stations. Strong wrinkles did not vary significantly overall, but their highest values were observed at the Middle station. Visible eye white was markedly higher at the Middle station than at the End station. The authors interpret this as evidence that facial indicators of emotional activation peaked during the middle phase of the route.
This temporal divergence is one of the study’s strongest conceptual contributions. Whole-body stress indicators increased progressively and were highest at the End station, suggesting cumulative fatigue, physical demand, and rider influence. Facial indicators peaked earlier, especially at the Middle station, suggesting that eye wrinkles and sclera visibility may respond more quickly to emotional arousal, novelty, crowd intensity, or environmental challenge. In simple terms, the horse’s face may show early emotional activation, while the body later shows accumulated fatigue and conflict.
The relationship between eye wrinkles and visible eye white was also analyzed. When mild and strong wrinkles were grouped together, horses with wrinkles had visible eye white in 30.5% of cases compared with 22.3% in horses without wrinkles, but this difference was not statistically significant. Mild wrinkles alone were also not significantly associated with sclera exposure. Strong wrinkles, however, were significantly associated with visible sclera, with χ² = 7.23 and p = 0.007. Horses with strong wrinkles had a 37.6% probability of visible eye white compared with 23.3% in horses without strong wrinkles.
This result should be interpreted carefully. It does not prove that strong wrinkles are a universal stress indicator. It shows that, in this dataset, strong wrinkles were meaningfully associated with another facial marker of arousal—visible sclera. Mild wrinkles were more variable and less informative. This supports the idea that wrinkle intensity matters. A simple yes/no wrinkle score may lose information; distinguishing mild from strong wrinkles may provide more nuanced welfare assessment.
The study’s strength lies in its field relevance. Many welfare studies occur in laboratories, clinics, or controlled facilities. This study took place in a real public equestrian event with crowds, noise, route progression, varied riders, and real management constraints. That makes the findings practically meaningful. It demonstrates that structured ethograms and facial indicators can be used during large-scale cultural events without interfering with the animals.
Another strength is the combination of horse behavior, rider behavior, and facial analysis. Welfare is not only an animal-internal state; it emerges from the interaction between the animal, handler, environment, task, equipment, and duration. By recording rider behavior alongside horse indicators, the study avoids treating horses as isolated biological systems. It recognizes that whip use, spurs, aggression, rein tension, and rider control may contribute to or respond to horse discomfort.
However, the limitations are substantial. First, the study is a preprint and has not been peer reviewed. Its methods, interpretations, and statistical presentation require external review. Second, the study is observational. It cannot prove causality. Third, one-minute observations provide snapshots, not continuous welfare histories. Fourth, the same horse may not have been followed across all stations, so route-level comparisons reflect station samples rather than verified within-horse changes from start to end.
Fifth, the study does not include physiological measures such as heart rate, heart-rate variability, cortisol, lactate, body temperature, hydration status, or respiratory rate. These measures could help distinguish physical exertion from emotional stress. Sixth, rider variables such as alcohol carrying or spur presence are observational and do not necessarily equal intoxication or active spur use. Seventh, eye photographs were filtered for quality, meaning the facial-expression dataset may not fully represent all observed horses. Camera angle, breed differences, eye morphology, lighting, and head position can influence sclera visibility and wrinkle classification.
Eighth, the study does not provide exact sample counts per station for each behavior in the main parsed text, although it reports percentages and statistical tests. Exact counts would make interpretation stronger. Ninth, cultural and management context matters. Welfare recommendations should be developed collaboratively with veterinarians, ethologists, event organizers, riders, public authorities, and community representatives rather than imposed from a single observational study alone.
The practical implications are nevertheless clear. Large public horse events should treat welfare monitoring as part of event management, not as an afterthought. Structured observation stations could be used to identify points along the route where stress indicators peak. If the End station consistently shows more head tossing, hyperflexion, pinned ears, salivation, whip use, and aggressive handling, organizers could consider route adjustments, rest points, hydration access, quieter zones, rider education, stricter enforcement of prohibited equipment, and monitoring of rider conduct.
One of the most important messages is that welfare problems can accumulate. A horse may begin the parade with manageable arousal, then face prolonged crowds, noise, heat, physical exertion, rein tension, rider pressure, and fatigue. By the end, behaviors may shift from early vigilance to visible conflict and exhaustion. This means welfare protocols should not only inspect horses before entry. They should monitor horses throughout the route and especially near the final phase.
The study also suggests that facial indicators may be useful for early detection. If eye white visibility and strong eye wrinkles peak at the Middle station, they may help identify emotional arousal before more obvious whole-body conflict behaviors become frequent. In practice, trained observers could use facial-expression indicators as part of a welfare-alert system, while remembering that facial signs require context and should not be interpreted mechanically.
For riders, the study’s lesson is not simply “do not use aids.” Rather, it points toward welfare-centered riding education. Horses in crowded events need preparation, conditioning, calm handling, appropriate tack, hydration planning, and riders capable of communication rather than escalating force. The increase in whip use and aggressive behavior toward the end suggests that some riders may respond to fatigue or reduced horse compliance with stronger pressure. Welfare training should emphasize recognizing fatigue and stress signals before conflict escalates.
For event organizers and authorities, the findings support stronger preventive management. Rules about spurs, whip use, alcohol, loading and unloading, water availability, rest areas, noise exposure, and route duration should be enforceable and observable. Since the study found significant station-related changes, monitoring should be spatially strategic. The middle and end of the route may require different welfare interventions: the middle may need attention to emotional arousal and overstimulation, while the end may need stronger attention to fatigue, rider conflict, and accumulated discomfort.
For the public, the study helps explain why welfare concerns may not always be visible as dramatic injury. Stress can appear as posture, facial tension, repeated head movements, nostril dilation, salivation, pinned ears, or changes in gait. These indicators do not mean every horse in the event is suffering severely, but they do show that a subset of horses may experience elevated stress. Recognizing subtle indicators allows tradition to be improved rather than merely defended or condemned.
The strongest finding in the study is the consistent increase in multiple horse and rider stress-related indicators toward the End station, supported by significant Chi-square results for dilated nostrils, neck hyperflexion, ears pinned backwards, excessive salivation, head tossing, collected trot, excessive whip use, spur presence, and aggressive rider behavior. The most nuanced finding is that facial indicators peaked at the Middle station, suggesting that emotional arousal and cumulative fatigue may follow different time courses.
The weakest part of the evidence is causal certainty. The study cannot prove whether fatigue, gait, rider behavior, crowd noise, heat, equipment, route length, alcohol, or individual horse differences were the main drivers. It also cannot determine whether any specific horse experienced pain, clinical distress, or lasting harm. What it can do is provide structured evidence that visible stress and discomfort indicators were not evenly distributed along the route and that some welfare risks intensified as the parade progressed.
Overall, this preprint contributes a practical welfare-monitoring framework for cultural equestrian events. It does not argue that traditions must disappear, nor does it prove that all participating horses were harmed. Its value is more constructive: it shows that non-invasive behavioral and facial indicators can identify where welfare pressure appears to increase, creating a basis for better rider education, event design, monitoring, and policy discussion. The most responsible conclusion is that public equestrian traditions can be preserved more ethically when they are willing to measure, understand, and reduce animal stress.
Source and Method Note
Source title: From tradition to equine welfare: measuring observational stress indicators during Costa Rica's National Horse Parade.
Authors: The author names are not clearly visible in the parsed PDF text available for this article. This should be stated cautiously as “authors not clearly identified in the parsed PDF text” unless the final PDF layout or original SSRN page provides author metadata.
Publication / preprint / report status: This is an SSRN-hosted preprint observational field study / animal welfare research manuscript. The PDF explicitly states that the manuscript has not been peer reviewed.
Peer-review status: Not peer reviewed. The findings should be interpreted as non-peer-reviewed preprint evidence and require cautious reading, independent review, and further validation before being treated as formal event-management or welfare policy guidance.
Subject area: Equine welfare, horse stress indicators, public equestrian events, animal behavior, ethograms, rider behavior, eye wrinkles, sclera visibility, non-invasive welfare assessment, and cultural event management.
Methods used: The study used a prospective observational field design during the Costa Rican National Horse Parade 2023. Trained observers recorded horse and rider behaviors using structured ethograms at three route stations: Start, Middle, and End. Horse indicators included excessive sweating, nostril dilation, neck position, ear position, salivation, head tossing, and gait. Rider indicators included excessive whip use, spur presence, aggressive behavior, and alcohol presence. Eye photographs were classified for wrinkle intensity and sclera visibility.
Dataset and experimental structure: Approximately 2,000 horses participated in the event. The study assessed 557 horses ethologically between 11:30 a.m. and 6:00 p.m. along a 3.5 km route in San José, Costa Rica. Three observation stations were placed at approximately 100 meters, 1.75 kilometers, and 3.4 kilometers. A total of 346 eye photographs of optimal quality were selected for facial-indicator classification.
Figures, tables, and page numbers: Table 1 on pages 3 and 27 defines the horse ethogram and interpretations for sweating, nostril position, neck position, ear position, salivation, head tossing, and gait. Table 2 on pages 4 and 28 defines rider indicators, including whip use, spurs, aggressive behavior, and alcohol. Figures 1 and 2 on pages 4-5 and enlarged on pages 21-22 show the eye wrinkle scale and sclera visibility scale. Figure 3 on pages 6 and 23 shows horse stress and discomfort indicators across Start, Middle, and End stations. Figure 4 on pages 7 and 24 shows rider behaviors across stations. Table 3 on pages 8 and 29 reports Chi-square and post hoc results for horse and rider indicators. Figure 5 on pages 9 and 25 shows correspondence-analysis biplots linking station location to physiological, behavioral, and rider variables. Figure 6 on pages 10 and 26 shows wrinkle intensity and visible eye white percentages across stations.
Formula and statistical explanation: The study does not introduce a central mathematical formula. It uses Chi-square tests of independence to evaluate whether behavior distributions differed across stations, two-proportion z-tests with Bonferroni correction for post hoc pairwise comparisons, Fisher’s exact test when expected cell counts were low, and correspondence analysis to visualize associations between station location and categorical variables. Statistical significance was set at p < 0.05.
Important caution: This article is an explanatory interpretation of a non-peer-reviewed preprint. It is not veterinary medical advice, not a diagnosis of any individual horse, not a legal judgment about any rider or event organizer, not an official welfare certification, not a regulatory order, not an event permit decision, not investment advice, not medical advice, not an engineering certification, not a religious ruling, and not an official policy directive. Welfare decisions for public equestrian events should be made with qualified veterinarians, equine behavior specialists, event organizers, public authorities, rider communities, and animal welfare professionals.